topotoolbox.StreamObject#
- class topotoolbox.StreamObject(flow: FlowObject, units: str = 'pixels', threshold: int | float | GridObject | ndarray = 0, stream_pixels: GridObject | ndarray | None = None, channelheads: ndarray | None = None)[source]#
Bases:
objectA class to represent stream flow accumulation based on a FlowObject.
- __init__(flow: FlowObject, units: str = 'pixels', threshold: int | float | GridObject | ndarray = 0, stream_pixels: GridObject | ndarray | None = None, channelheads: ndarray | None = None) None[source]#
Initializes the StreamObject by processing flow accumulation.
- Parameters:
flow (FlowObject) – The input flow object containing source, target, direction, and other properties related to flow data.
units (str, optional) – Units of measurement for the flow data. Can be ‘pixels’, ‘mapunits’, ‘m2’, or ‘km2’. Default is ‘pixels’.
threshold (int | float | GridObject | np.ndarray, optional) – The upslope area threshold for flow accumulation. This can be an integer, float, GridObject, or a NumPy array. If more water than in the threshold has accumulated in a cell, it is part of the stream. Default is 0, which will result in the threshold being generated based on this formula: threshold = (avg^2)*0.01 where shape = (n,m).
stream_pixels (GridObject | np.ndarray, optional) – A GridObject or np.ndarray made up of zeros and ones to denote where the stream is located. Using this will overwrite any use of the threshold argument.
channelheads ((rows, cols), optional) – A tuple of two array-like objects containing the row and column indices of the channel heads. All streams downstream of the indicated channel heads will be returned in the StreamObject.
- Raises:
ValueError – If the units parameter is not ‘pixels’, ‘mapunits’, ‘m2’, or ‘km2’.
ValueError – If the shape of the threshold does not match the flow object shape.
Example
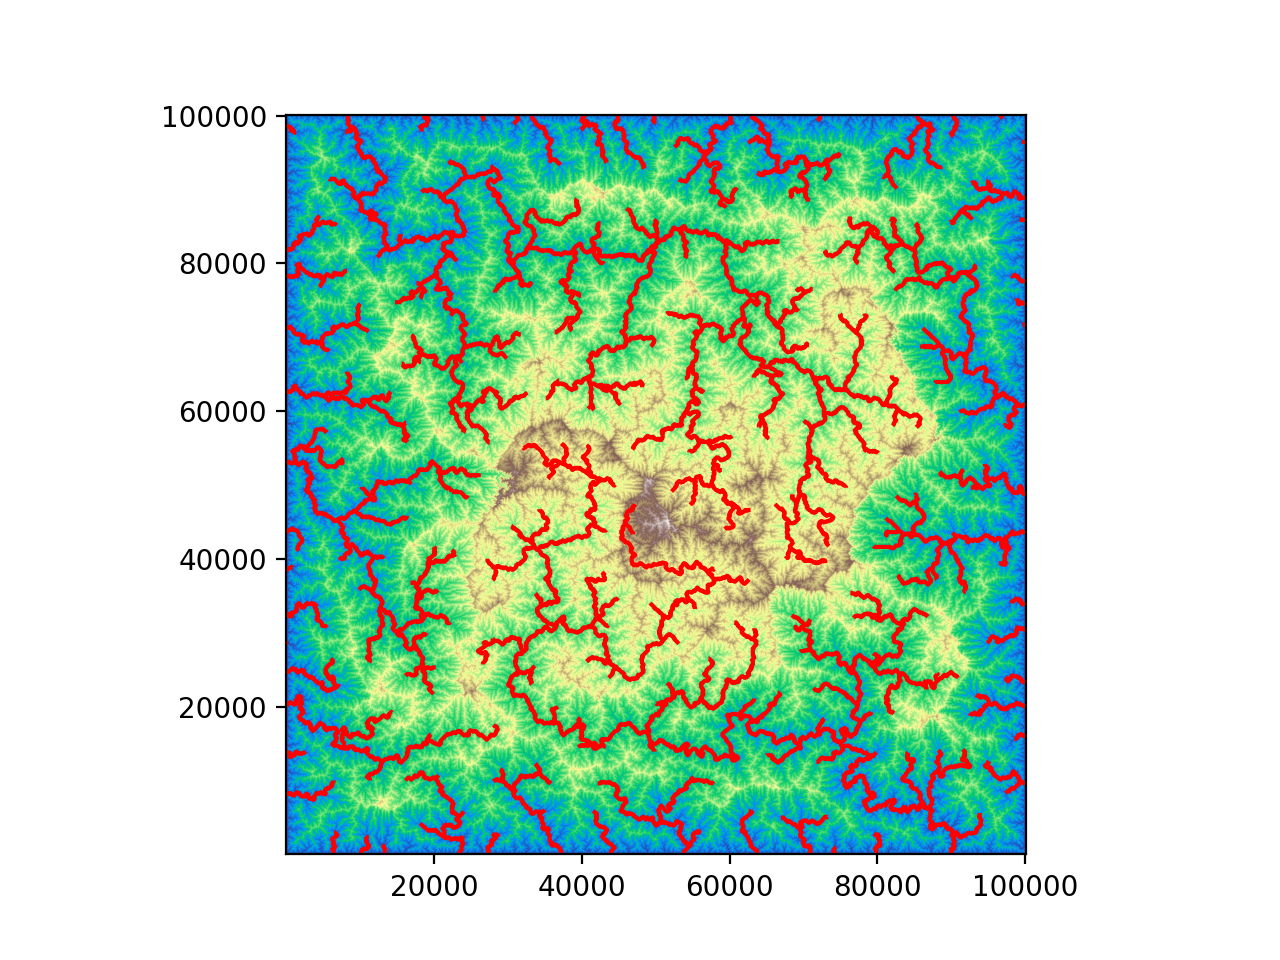
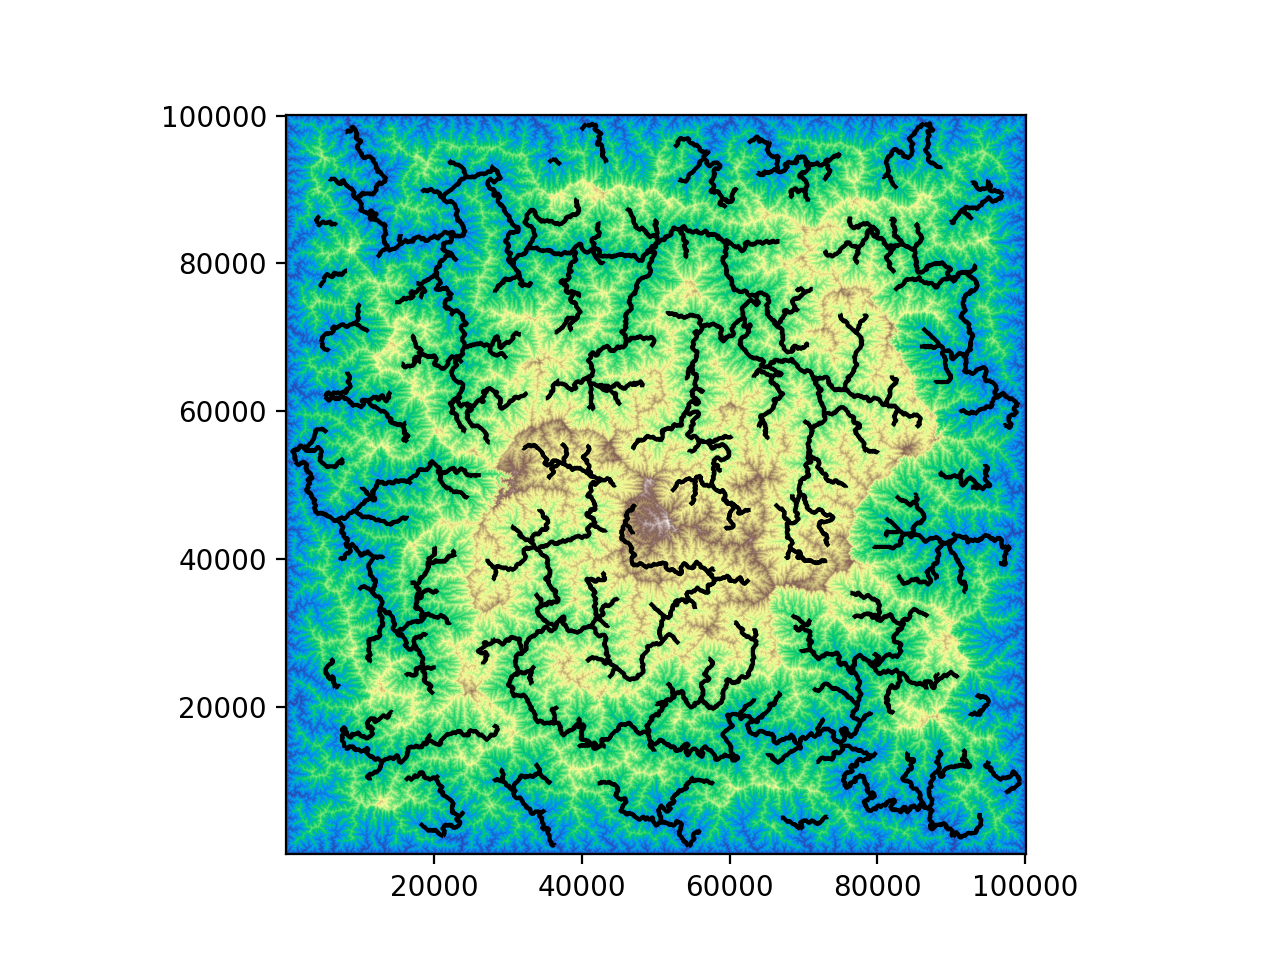
>>> import topotoolbox
>>> import matplotlib.pyplot as plt
>>> dem = topotoolbox.load_dem('perfectworld')
>>> fd = topotoolbox.FlowObject(dem)
>>> s = topotoolbox.StreamObject(fd,threshold=1000,units='pixels')
>>> fig, ax = plt.subplots()
>>> _= dem.plot(cmap="terrain")
>>> _= s.plot(color='r')
>>> plt.show()
(
Source code,png,hires.png,pdf)
Methods
__init__(flow[, units, threshold, ...])Initializes the StreamObject by processing flow accumulation.
chitransform(upstream_area[, a0, mn, k, ...])Coordinate transformation using the integral approach
clean()Remove disconnected nodes in stream networks
Label connected components in a stream network
crs(dem[, tau, k, mingradient, fixedoutlet])Elevation values along stream networks are frequently affected by large scatter, often as a result of data artifacts or errors.
crslin(dem[, k, mingradient, attachheads, ...])Elevation values along stream networks are frequently affected by large scatter, often as a result of data artifacts or errors.
distance([kind])Compute distances along the stream network
Compute the maximum distance between a node in the stream network and the channel head.
downstreamto(nodes)Extract the portion of the stream network downstream of the given nodes
ezgetnal(k[, dtype])Retrieve a node attribute list from k
gradient(dem[, impose])Calculates the stream slope for each node in the stream network S based on the associated digital elevation model DEM.
klargestconncomps([k])Extract the k largest connected components of the stream network
knickpointfinder(dem[, knickpoints, ...])Find knickpoints in river profiles
ksn(dem, a[, impose, theta])Returns the normalized steepness index using a default concavity index of 0.45.
lowerenv(dem, kn)Compute the lower convex envelope of a stream profile
node_indices_where(nal)The row and column indices of the nodes of the stream network where a condition is satisfied.
Compute the pixel-to-pixel distance for each edge.
plot([ax, scalex, scaley])Plot the StreamObject
plotdz(z[, distance, ax, dunit, doffset, ...])Plot a node attribute list against upstream distance
quantcarve(dem[, tau, mingradient, fixedoutlet])Elevation values along stream networks are frequently affected by large scatter, often as a result of data artifacts or errors.
removeedgeeffects(fd[, dem])Remove segments of the stream network downstream of DEM boundaries
streamorder([method])Calculates stream order from the StreamObject using the Strahler or Shreve method
streampoi(point_type)Extract points of interest from the stream network
subgraph(nal)Extract a subset of the stream network
Convert the stream network to a GeoDataFrame.
to_grid([nal])Convert StreamObject to GridObject
to_shapefile(path)Convert the stream network to a georeferenced shapefile.
trunk([downstream_distance, flow_accumulation])Reduces a stream network to the longest streams in each stream network tree (e.g. connected component).
Compute the upstream distance for a node in the stream network
upstreamto(nodes)Extract the portion of the stream network upstream of the given nodes
xy([data])Compute the x and y coordinates of continuous stream segments
Attributes
Return x and y coordinates of the nodes in the stream network.
mask with the shape of the original grid with stream indices.
The row and column indices of the nodes of the stream network.
The row and column indices of the sources of each edge in the stream network.
The row and column indices of the targets of each edge in the stream network.
Return x coordinates of the nodes in the stream network
Return y coordinates of the nodes in the stream network
- chitransform(upstream_area: GridObject | ndarray, a0: float = 1000000.0, mn: float = 0.45, k: GridObject | ndarray | None = None, correctcellsize: bool = True)[source]#
Coordinate transformation using the integral approach
Transforms the horizontal spatial coordinates of a river longitudinal profile using an integration in upstream direction of drainage area (chi, see Perron and Royden, 2013).
- Parameters:
upstream_area (GridObject | np.ndarray) – Raster with the upstream areas. Must be the same size and projection as the GridObject used to create the StreamObject.
a0 (float, optional) – Reference area in the same units as the upstream_area raster. Defaults to 100_000.
mn (float, optional) – mn-ratio. Defaults to 0.45.
k (GridObject | np.ndarray | None, optional) – Erosional efficiency, which may vary spatially. If k is supplied, then chitransform returns the time needed for a signal (knickpoint) propagating upstream from the outlet of the stream network. If k has units of m^(1 - 2m) / y, then time will have units of y. Note that calculating the response time requires the assumption that n=1. Defaults to None, which does not use the erosional efficiency.
correctcellsize (bool, optional) – If true, multiplies the upstream_area raster by self.cellsize**2. Use if a0 has the same units of self.cellsize**2 and upstream_area has units of pixels, such as the default output from flow_accumulation. If the units of upstream_area are already m^2, then set correctcellsize to False. Defaults to True.
- Raises:
ValueError – If upstream_area or k does not have the right shape to be indexed by the StreamObject.
TypeError – If upstream_area or k does not represent a type of data that can be extracted into a node attribute list.
TypeError – If the modified upstream area is not a supported floating point type.
- clean() StreamObject[source]#
Remove disconnected nodes in stream networks
- Returns:
A stream network where all isolated nodes have been removed
- Return type:
Example
>>> import topotoolbox
>>> dem = topotoolbox.load_dem('bigtujunga')
>>> fd = topotoolbox.FlowObject(dem)
>>> s = topotoolbox.StreamObject(fd,threshold=1000)
>>> sc = s.clean()
>>> assert sc.stream.shape <= s.stream.shape
- conncomps() ndarray[source]#
Label connected components in a stream network
- Returns:
A node attribute list containing the labels of each connected component. The labels range from 1 to the number of connected components in the network.
- Return type:
np.ndarray
- property coordinates: tuple[ndarray, ndarray]#
Return x and y coordinates of the nodes in the stream network.
- Returns:
A pair of node attribute lists containing x and y coordinates of each node.
- Return type:
tuple of ndarray
- crs(dem, tau=0.5, k=1, mingradient=0.0, fixedoutlet=False) ndarray[source]#
Elevation values along stream networks are frequently affected by large scatter, often as a result of data artifacts or errors. This function returns a node attribute list of smoothed elevation values calculated by nonparametric quantile regression with monotonicity constraints.
The algorithm written in this function follows Appendix A4 in the Schwanghart and Scherler 2017 paper.
Parameters:#
s: StreamObject
- dem: GridObject | np.ndarray
DEM
- tau: float
Quantile. Default is 0.5
- k: float
positive scalar that dictates the degree of stiffness. Default is 1
- mingradient: double
Minimum downward gradient. Choose carefully, because length profile may dip to steeply. Set this parameter to nan if you do not wish to have a monotonous dowstream elevation decrease.
- fixedoutlet: bool
If true, elevations of outlets are fixed.
- returns:
node attribute list with smoothed elevation values
- rtype:
zs
- crslin(dem, k=1, mingradient=0.0, attachheads=False, attachtomin=False)[source]#
Elevation values along stream networks are frequently affected by large scatter, often as a result of data artifacts or errors. This function returns a node attribute list of elevations calculated by regularized smoothing.
The algorithm written in this function follows Appendix A2 in the Schwanghart and Scherler 2017 paper.
Parameters:#
s: StreamObject
- dem: GridObject | np.ndarray
DEM
- k: float
positive scalar that dictates the degree of stiffness. Default is 1
- mingradient: double
Minimum downward gradient. Choose carefully, because length profile may dip to steeply. Set this parameter to nan if you do not wish to have a monotonous dowstream elevation decrease.
- attachtomin: bool
Smoothed elevations will not exceed local minima along the downstream path. (only applicable if ‘mingradient’ is not nan)
- attachheads: bool
If true, elevations of channelheads are fixed. (only applicable if ‘mingradient’ is not nan). Note that for large K, setting attachheads to true can result in excessive smoothing and underestimation of elevation values directly downstream to channelheads.
- returns:
node attribute list with smoothed elevation values
- rtype:
zs
- distance(kind='from_outlet')[source]#
Compute distances along the stream network
- Parameters:
kind (string) –
The kind of distance to return. One of
’from_outlet’ (default): distance in upstream direction
’min_from_ch’: shortest from channelhead
’max_from_ch’: longest from channelhead
’node_to_node’: distance between each node and its downstream neighbor
- Returns:
A node attribute list with the requested distances.
- Return type:
np.ndarray
- Raises:
ValueError – If method is currently unsupported
- downstream_distance() ndarray[source]#
Compute the maximum distance between a node in the stream network and the channel head.
- Returns:
A node attribute list with the downstream distances
- Return type:
np.ndarray, float32
- downstreamto(nodes) StreamObject[source]#
Extract the portion of the stream network downstream of the given nodes
- Parameters:
nodes (GridObject or np.ndarray) – A logical node attribute list or grid that is True for the desired nodes.
- Returns:
A stream network containing those nodes of the original one that are downstream of the given nodes.
- Return type:
Example
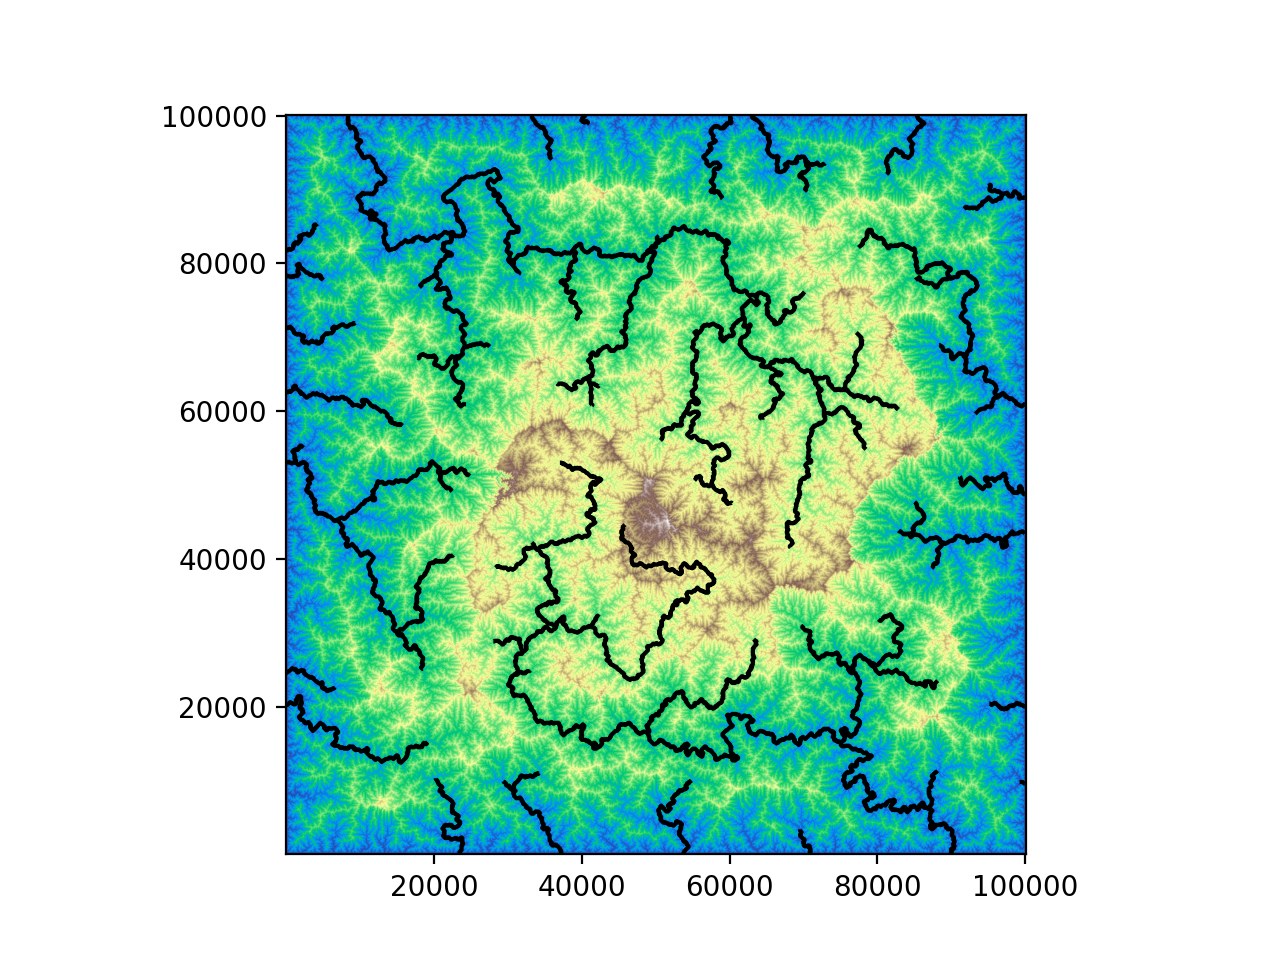
>>> import topotoolbox
>>> import numpy as np
>>> import matplotlib.pyplot as plt
>>> dem = topotoolbox.load_dem('perfectworld')
>>> fd = topotoolbox.FlowObject(dem)
>>> s = topotoolbox.StreamObject(fd,threshold=1000,units='pixels')
>>> confluences = s.streampoi('confluences')
>>> s2 = s.downstreamto(confluences)
>>> fig,ax = plt.subplots()
>>> _= dem.plot(ax=ax,cmap="terrain")
>>> _= s2.plot(ax=ax,color='k')
>>> plt.show()
(
Source code,png,hires.png,pdf)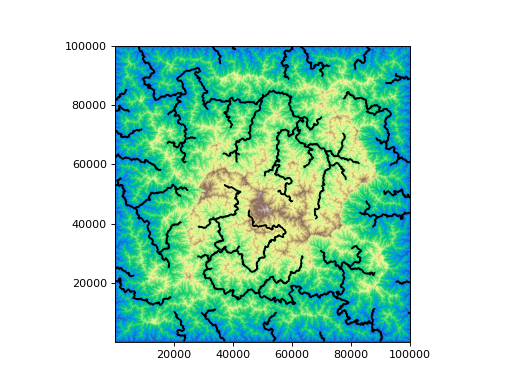
- ezgetnal(k, dtype=None)[source]#
Retrieve a node attribute list from k
- Parameters:
k (GridObject | np.ndarray | float) – The object from which node values will be extracted. If k is a GridObject or an np.ndarray with the same shape as the underlying DEM of this StreamObject, the node values will be extracted from the grid by indexing. If k is an array with the same shape as the node attribute list, ezgetnal returns a copy of k. If k is a scalar value, ezgetnal returns an array of the right shape filled with k.
- Returns:
The resulting array will always be a copy of the input array.
- Return type:
np.ndarray
- Raises:
ValueError – If k does not have the right shape to be indexed by the StreamObject.
- gradient(dem, impose=False) ndarray[source]#
Calculates the stream slope for each node in the stream network S based on the associated digital elevation model DEM.
- Parameters:
dem (GridObject or np.ndarray) – A node attribute list or grid that provides the elevation that we take the gradient of.
impose (bool) – Minima imposition to avoid negative slopes (see imposemin)
- Returns:
stream gradient as node-attribute list
- Return type:
s
- property gridmask: ndarray#
mask with the shape of the original grid with stream indices.
- Returns:
2D array where rivers are 1 and non-river pixels are 0.
- Return type:
ndarray
- klargestconncomps(k=1) StreamObject[source]#
Extract the k largest connected components of the stream network
Components are ordered by the number of stream network pixels.
- Parameters:
k (integer, optional) – The number of components to keep. The default is 1
- Returns:
A new StreamObject containing only the k largest connected components
- Return type:
Example
>>> import topotoolbox
>>> import matplotlib.pyplot as plt
>>> dem = topotoolbox.load_dem('perfectworld')
>>> fd = topotoolbox.FlowObject(dem)
>>> s = topotoolbox.StreamObject(fd,threshold=1000,units='pixels')
>>> s2 = s.klargestconncomps(1)
>>> fig, ax = plt.subplots()
>>> _= dem.plot(ax=ax,cmap="terrain")
>>> _= s2.plot(ax=ax,color='k')
>>> plt.show()
(
Source code,png,hires.png,pdf)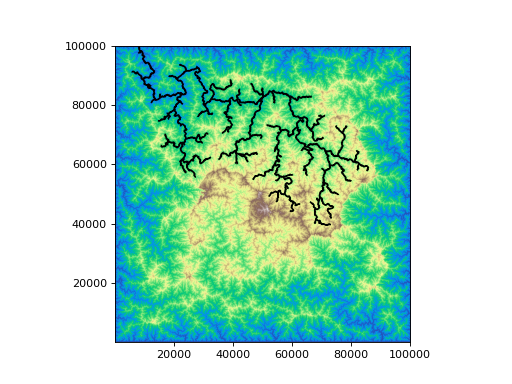
- knickpointfinder(dem: GridObject | ndarray, knickpoints: ndarray | None = None, tolerance: float = 100.0, iterations: int | None = None) ndarray[source]#
Find knickpoints in river profiles
Rivers that adjust to changing base levels or have diverse lithologies often feature knickzones, i.e. pronounced convex sections that separate the otherwise concave equilibrium profile. The profile should be monotoneously decreasing (see imposemin, quantcarve, crs).
This function extracts knickpoints, i.e. sharp convex sections in the river profile. This is accomplished by an algorithm that adjusts a strictly concave upward profile to an actual profile in the DEM or node-attribute list. The algorithm iteratively relaxes the concavity constraint at those nodes in the river profile that have the largest elevation offsets between the strictly concave and actual profile until the offset falls below a user-defined tolerance.
- Parameters:
dem (GridObject or np.ndarray) – The elevation data of the stream network provided either as a GridObject compatible with this StreamObject or as a node attribute list. The elevation data is automatically processed using imposemin to ensure that it is decreasing downstream. If additional smoothing of the stream profile is needed, use a function like quantcarve or crslin and pass the resulting node attribute list to knickpointfinder.
knickpoints (np.ndarray) – A logical node attribute list that is True for any stream network nodes that should be considered knickpoints a priori
tolerance (float) –
The maximum difference between the DEM and a modeled convex profile that will be considered a knickpoint
Setting this higher will identify fewer knickpoints while setting it lower finds more knickpoints. It is set by default to 100 m, but users should choose a tolerance based on their data and needs.
iterations (int) –
The maximum number of iterations that will be run
knickpointfinder will identify more than one knickpoint per iteration, so this argument does not completely control the number of knickpoints identified. The default is the number of nodes in the stream network, and the iteration count is always limited to the number of nodes in the stream network.
- Returns:
A logical node attribute list that is True for stream network nodes that are identified as knickpoints
- Return type:
np.ndarray
Example
>>> import topotoolbox
>>> import matplotlib.pyplot as plt
>>> dem = topotoolbox.load_dem('bigtujunga')
>>> fd = topotoolbox.FlowObject(dem)
>>> s = topotoolbox.StreamObject(fd)
>>> s = s.klargestconncomps(1)
>>> z = topotoolbox.imposemin(s, dem)
>>> kp = s.knickpointfinder(z, tolerance=50.0)
>>> d = s.upstream_distance()
>>> fig,ax = plt.subplots()
>>> _= s.plotdz(dem, ax=ax, color='k')
>>> _= ax.scatter(d[kp], z[kp])
>>> _= ax.autoscale_view()
>>> plt.show()
(
Source code,png,hires.png,pdf)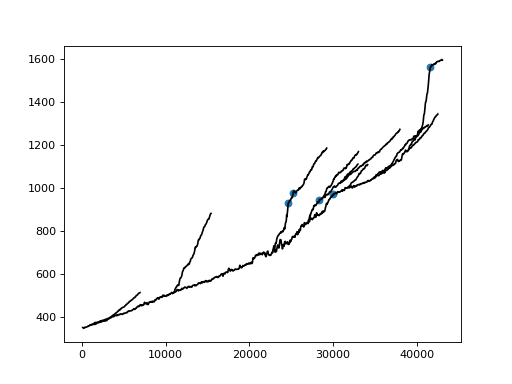
- ksn(dem, a, impose=False, theta=0.45) ndarray[source]#
Returns the normalized steepness index using a default concavity index of 0.45.
- Parameters:
dem (GridObject or np.ndarray) – Digital elevation model
a (GridObject) – Flow accumulation as returned by flowacc (GridObject)
impose (bool) – Minima imposition to avoid negative slopes (see imposemin
theta (float) – Concavity (default 0.45)
- Returns:
Normalized steepness index
- Return type:
k
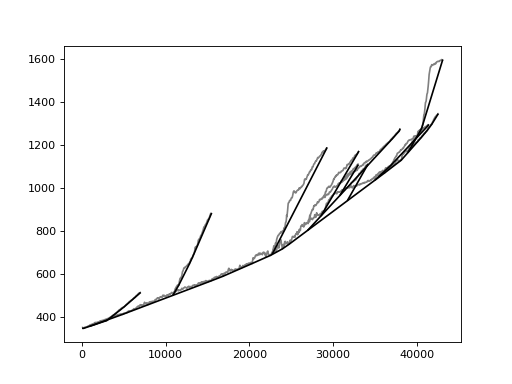
- lowerenv(dem: GridObject | ndarray, kn: ndarray) ndarray[source]#
Compute the lower convex envelope of a stream profile
- Parameters:
dem (GridObject or np.ndarray) – The elevation data of the stream network provided either as a GridObject compatible with this StreamObject or as a node attribute list. The elevation data should be decreasing downstream. Preprocess with imposemin or quantcarve if necessary.
kn (np.ndarray) – A logical node attribute list that is true for nodes that should be considered knickpoints, where the stream profile need not be convex.
- Returns:
A node attribute list containing the elevation of the smoothed profile.
- Return type:
np.ndarray
Example
>>> import topotoolbox
>>> import numpy as np
>>> import matplotlib.pyplot as plt
>>> dem = topotoolbox.load_dem('bigtujunga')
>>> fd = topotoolbox.FlowObject(dem)
>>> s = topotoolbox.StreamObject(fd)
>>> s = s.klargestconncomps(1)
>>> z = topotoolbox.imposemin(s, dem)
>>> kn = np.zeros(len(z), dtype=bool)
>>> ze = s.lowerenv(z, kn)
>>> fig,ax = plt.subplots()
>>> _= s.plotdz(dem, ax=ax, color='gray')
>>> _= s.plotdz(ze, ax=ax, color='black')
>>> ax.autoscale_view()
>>> plt.show()
(
Source code,png,hires.png,pdf)
- property node_indices: tuple[ndarray, ...]#
The row and column indices of the nodes of the stream network.
- Returns:
tuple of ndarray – A tuple of arrays containing the row indices and column
indices for the nodes in the stream network. Each of these
arrays is a node attribute lists and have a length equal to
the number of nodes in the stream network. This tuple of
arrays is suitable for indexing GridObjects or arrays shaped
like the GridObject from which this StreamObject was derived.
- node_indices_where(nal: ndarray) tuple[ndarray, ...][source]#
The row and column indices of the nodes of the stream network where a condition is satisfied.
- Returns:
tuple of ndarray – A tuple of arrays containing the row indices and column
indices for the nodes in the stream network where the input
Boolean node attribute list nal is true. Each of these
arrays is a node attribute lists and have a length equal to
the number of nodes in the stream network. This tuple of
arrays is suitable for indexing GridObjects or arrays shaped
like the GridObject from which this StreamObject was derived.
- node_to_node_distance() ndarray[source]#
Compute the pixel-to-pixel distance for each edge.
- Returns:
An edge attribute list with the distance between pixels
- Return type:
np.ndarray, float32
Example
>>> import topotoolbox
>>> dem = topotoolbox.load_dem('perfectworld')
>>> fd = topotoolbox.FlowObject(dem)
>>> s = topotoolbox.StreamObject(fd,threshold=1000,units='pixels')
>>> print(s.node_to_node_distance())
- plot(ax=None, scalex=True, scaley=True, **kwargs)[source]#
Plot the StreamObject
Stream segments as computed by StreamObject.xy are plotted using a LineCollection.
- Parameters:
ax (matplotlib.axes.Axes, optional) – The axes in which to plot the StreamObject. If no axes are given, the current axes are used.
scalex (bool, optional) – Autoscale the x-axis limits. Defaults to True. If the x-axis limits have been set manually with set_xlim, the autoscaling will not be applied regardless of the value of scalex.
scaley (bool, optional) – Autoscale the y-axis limits. Defaults to True. If the y-axis limits have been set manually with set_ylim, the autoscaling will not be applied regardless of the value of scaley.
**kwargs – Additional keyword arguments are forwarded to LineCollection
- Returns:
The axes into which the StreamObject has been plotted.
- Return type:
matplotlib.axes.Axes
Example
>>> import topotoolbox
>>> import matplotlib.pyplot as plt
>>> dem = topotoolbox.load_dem('perfectworld')
>>> fd = topotoolbox.FlowObject(dem)
>>> s = topotoolbox.StreamObject(fd,threshold=1000,units='pixels')
>>> fig, ax = plt.subplots()
>>> _= dem.plot(cmap="terrain")
>>> _= s.plot(color='r')
>>> plt.show()
(
Source code,png,hires.png,pdf)
- plotdz(z, distance=None, ax=None, dunit: str = 'm', doffset: float = 0, scalex=True, scaley=True, **kwargs)[source]#
Plot a node attribute list against upstream distance
- Parameters:
z (GridObject, np.ndarray) – The node attribute list that will be plotted on the y axis
distance (GridObject, np.ndarray) – The node attribute list that will be plotted on the x axis
ax (matplotlib.axes.Axes, optional) – The axes in which to plot the StreamObject. If no axes are given, the current axes are used.
dunit (str, optional) – The unit to plot the upstream distance. Should be either ‘m’ for meters or ‘km’ for kilometers.
doffset (float, optional) – An offset to be applied to the upstream distance. doffset should be in the units specified by dunit.
scalex (bool, optional) – Autoscale the x-axis limits. Defaults to True. If the x-axis limits have been set manually with set_xlim, the autoscaling will not be applied regardless of the value of scalex.
scaley (bool, optional) – Autoscale the y-axis limits. Defaults to True. If the y-axis limits have been set manually with set_ylim, the autoscaling will not be applied regardless of the value of scaley.
**kwargs – Additional keyword arguments are forwarded to LineCollection
- Returns:
The axes into which the plot as been added
- Return type:
matplotlib.axes.Axes
- Raises:
ValueError – If dunit is not one of ‘m’ or ‘km’.
- quantcarve(dem, tau=0.5, mingradient=0.0, fixedoutlet=False) ndarray[source]#
Elevation values along stream networks are frequently affected by large scatter, often as a result of data artifacts or errors. This function returns a node attribute list of elevations calculated by carving the DEM. Conversely to conventional carving, quantcarve will not run along minimas of the DEM. Instead, quantcarve returns a profile that runs along the tau’s quantile of elevation conditional horizontal distance of the river profile.
The algorithm written in this function follows Appendix A3 in the Schwanghart and Scherler 2017 paper.
- Parameters:
s (StreamObject)
dem (GridObject | np.ndarray) – Digital Elevation Model
tau (float) – Quantile. Default is 0.5
mingradient (float) – Minimum downward gradient.
fixedoutlet (bool) – If true, elevations of outlets are fixed.
mingradient – Minimum downward gradient.
- Returns:
Node attribute list with with smoothed elevation values
- Return type:
zs
- removeedgeeffects(fd, dem=None)[source]#
Remove segments of the stream network downstream of DEM boundaries
- Parameters:
fd (FlowObject)
dem (GridObject) – If a GridObject is supplied, NaNs in the GridObject are additionally considered as boundary pixels.
- Raises:
ValueError – The supplied FlowObject is not aligned to the StreamObject.
- property source_indices: tuple[ndarray, ...]#
The row and column indices of the sources of each edge in the stream network.
- Returns:
tuple of ndarray – A tuple of arrays containing the row indices and column
indices of the sources of each edge in the stream
network. Each of these arrays is an edge attribute lists and
have a length equal to the number of edges in the stream
network. This tuple of arrays is suitable for indexing
GridObjects or arrays shaped like the GridObject from which
this StreamObject was derived.
- streamorder(method='strahler') ndarray[source]#
Calculates stream order from the StreamObject using the Strahler or Shreve method
- Parameters:
s (StreamObject)
method (string) – Strahler (default) or Shreve method
- Returns:
Stream order for each node in StreamObject
- Return type:
s_order
- streampoi(point_type: str) ndarray[source]#
Extract points of interest from the stream network
Currently supported points of interest are ‘channelheads’, ‘outlets’ and ‘confluences’
- Parameters:
point_type ('channelheads' or 'outlets' or 'confluences') – The type of points to select from the stream network
- Returns:
A logical node attribute list indicating the locations of points.
- Return type:
np.ndarray
- Raises:
ValueError – If an unknown point type is requested.
- subgraph(nal)[source]#
Extract a subset of the stream network
- Parameters:
nal (GridObject or np.ndarray) – A logical node attribute list indicating the desired nodes of the new stream network
- Returns:
A StreamObject representing the desired subset of the stream network.
- Return type:
Example
>>> import topotoolbox
>>> import numpy as np
>>> import matplotlib.pyplot as plt
>>> dem = topotoolbox.load_dem('perfectworld')
>>> dem = topotoolbox.load_dem('perfectworld')
>>> fd = topotoolbox.FlowObject(dem)
>>> s = topotoolbox.StreamObject(fd,threshold=1000,units='pixels')
>>> shape = dem.shape
>>> arr = (np.arange(np.prod(shape))<np.prod(shape)//4).reshape(shape)
>>> s2 = s.subgraph(arr)
>>> fig,ax = plt.subplots()
>>> _= dem.plot(ax=ax,cmap="terrain")
>>> _= s2.plot(ax=ax,color='k')
>>> plt.show()
(
Source code,png,hires.png,pdf)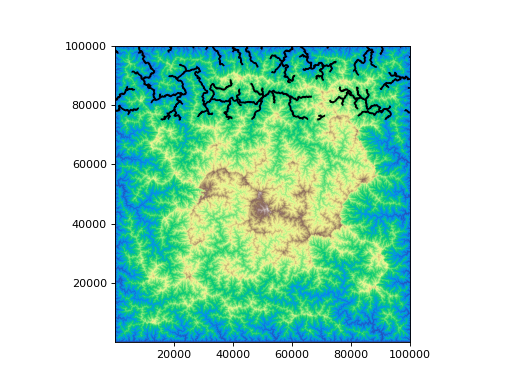
- property target_indices: tuple[ndarray, ...]#
The row and column indices of the targets of each edge in the stream network.
- Returns:
tuple of ndarray – A tuple of arrays containing the row indices and column
indices of the sources of each edge in the stream
network. Each of these arrays is an edge attribute lists and
have a length equal to the number of edges in the stream
network. This tuple of arrays is suitable for indexing
GridObjects or arrays shaped like the GridObject from which
this StreamObject was derived.
- to_geodataframe()[source]#
Convert the stream network to a GeoDataFrame.
- Returns:
The GeoDataFrame.
- Return type:
geopandas.GeoDataFrame
Example
>>> import topotoolbox
>>> import matplotlib.pyplot as plt
>>> dem = topotoolbox.load_dem('bigtujunga')
>>> fd = topotoolbox.FlowObject(dem)
>>> s = topotoolbox.StreamObject(fd)
>>> s_gdf = s.to_geodataframe()
- to_grid(nal=None)[source]#
Convert StreamObject to GridObject
- Parameters:
nal (GridObject | np.ndarray | float, optional) – Node attribute list to map onto the grid. If None, creates a boolean grid with True at stream locations. If provided, creates a grid with the node values at stream locations and nan elsewhere.
- Returns:
A GridObject with the same spatial reference as the StreamObject. If nal is None, contains boolean values (True for streams). Otherwise, contains the nal values at stream locations and nan elsewhere.
- Return type:
- to_shapefile(path: str) None[source]#
Convert the stream network to a georeferenced shapefile.
- Parameters:
path (str) – path where the shapefile will be saved.
Example
>>> import topotoolbox
>>> import matplotlib.pyplot as plt
>>> dem = topotoolbox.load_dem('bigtujunga')
>>> fd = topotoolbox.FlowObject(dem)
>>> s = topotoolbox.StreamObject(fd)
>>> s.to_shapefile('stream_network.shp')
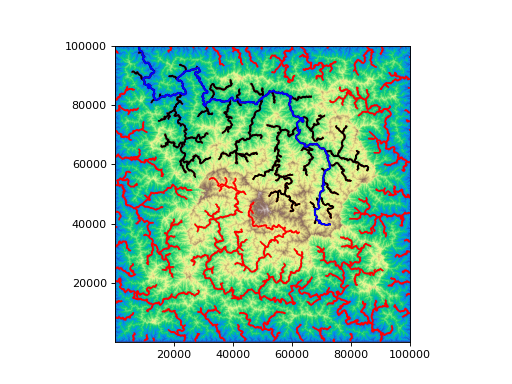
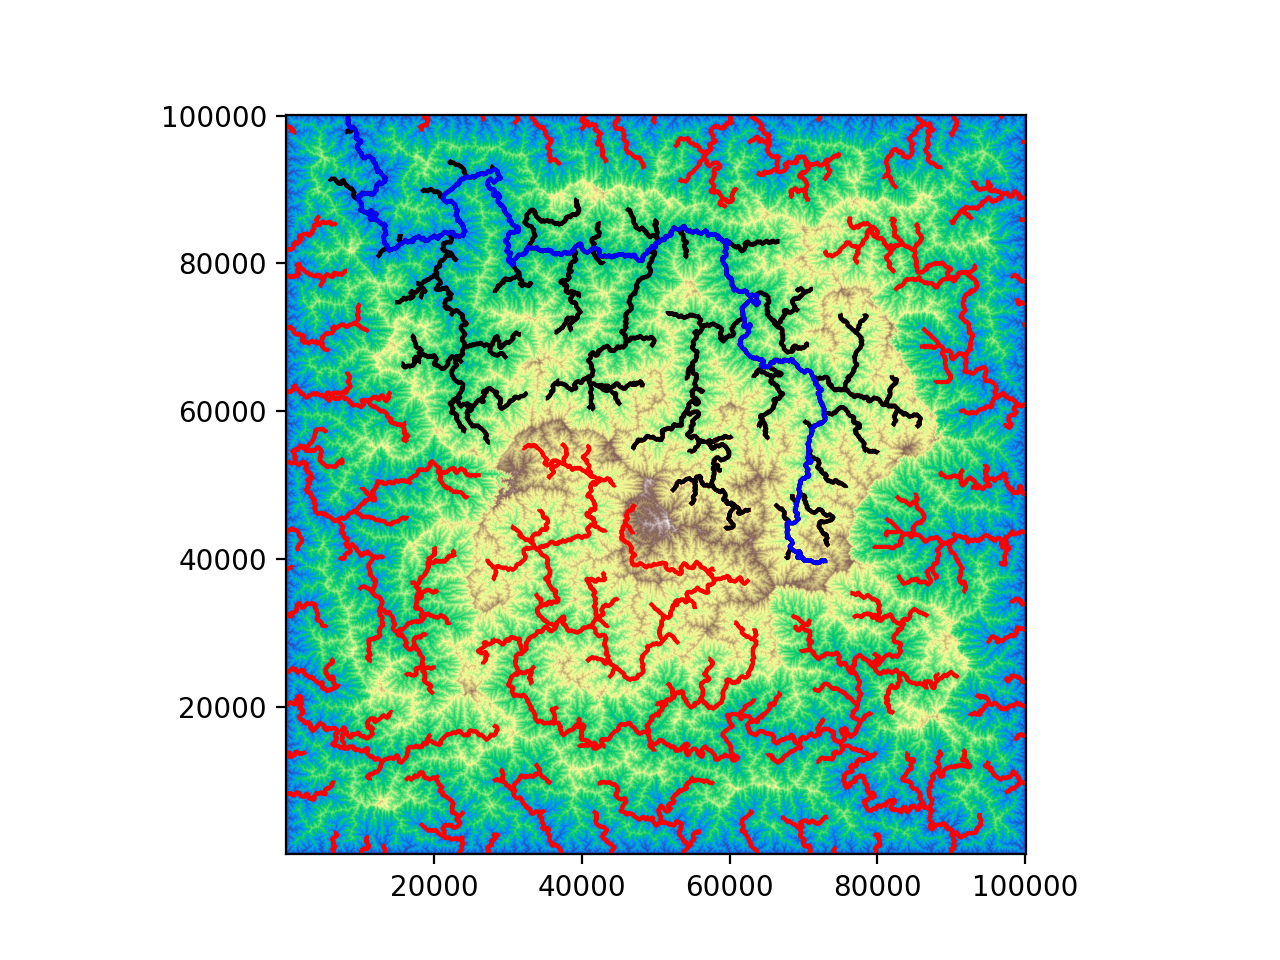
- trunk(downstream_distance: ndarray | None = None, flow_accumulation: GridObject | None = None) StreamObject[source]#
Reduces a stream network to the longest streams in each stream network tree (e.g. connected component). The algorithm identifies the main trunk by sequently tracing the maximum downstream distance in upstream direction.
- Parameters:
flow_accumulation (Gridobject, optional) – A GridObject filled with flow accumulation values (as returned by the function FlowObject.flow_accumulation). Defaults to None.
downstream_distance (np.ndarray, optional) – A numpy ndarray node-attribute list as generated by ezgetnal(). This argument overwrites the flow_accumulation if used. Defaults to None.
- Returns:
StreamObject with truncated streams.
- Return type:
Example
>>> import topotoolbox
>>> import matplotlib.pyplot as plt
>>> dem = topotoolbox.load_dem('perfectworld')
>>> fd = topotoolbox.FlowObject(dem)
>>> s = topotoolbox.StreamObject(fd,threshold=1000,units='pixels')
>>> s2 = s.klargestconncomps(1)
>>> st = s2.trunk()
>>> fig,ax = plt.subplots()
>>> _= dem.plot(ax=ax,cmap="terrain")
>>> _= s.plot(ax=ax, color='r')
>>> _= s2.plot(ax=ax,color='k')
>>> _= st.plot(ax=ax, color='b')
>>> plt.show()
(
Source code,png,hires.png,pdf)
- upstream_distance() ndarray[source]#
Compute the upstream distance for a node in the stream network
- Returns:
A node attribute list with the upstream distances
- Return type:
np.ndarray, float32
- upstreamto(nodes) StreamObject[source]#
Extract the portion of the stream network upstream of the given nodes
- Parameters:
nodes (GridObject or np.ndarray) – A logical node attribute list or grid that is True for the desired nodes.
- Returns:
A stream network containing those nodes of the original one that are upstream of the given nodes.
- Return type:
Example
>>> import topotoolbox
>>> import numpy as np
>>> import matplotlib.pyplot as plt
>>> dem = topotoolbox.load_dem('perfectworld')
>>> fd = topotoolbox.FlowObject(dem)
>>> s = topotoolbox.StreamObject(fd,threshold=1000,units='pixels')
>>> confluences = s.streampoi('confluences')
>>> s2 = s.upstreamto(confluences)
>>> fig,ax = plt.subplots()
>>> _= dem.plot(ax=ax,cmap="terrain")
>>> _= s2.plot(ax=ax,color='k')
>>> plt.show()
(
Source code,png,hires.png,pdf)
- property x: ndarray#
Return x coordinates of the nodes in the stream network
If you are trying to get both x and y coordinates, it is slightly more efficient to use coordinates.
- Returns:
A node attribute list containing the x coordinates of each node
- Return type:
ndarray
- xy(data=None)[source]#
Compute the x and y coordinates of continuous stream segments
- Parameters:
data (tuple, optional) – A tuple of two node attribute lists representing the desired x and y values for each pixel in the stream network. If this argument is not supplied, the returned x and y values are the geographic coordinates of the node.
- Returns:
A list of lists of (x,y) pairs.
- Return type:
list
- property y: ndarray#
Return y coordinates of the nodes in the stream network
If you are trying to get both x and y coordinates, it is slightly more efficient to use coordinates.
- Returns:
A node attribute list containing the y coordinates of each node
- Return type:
ndarray