Interaction between GridObjects#
In this Jupyter Notebook, the magic functions of the gridObject are explained. These are operations like adding two GridObjects together. Instead of utilizing functions that could look like new_dem = topo.add(dem1, dem2), this package utilizes magic functions. The same addition will therefor look like this: new_dem = dem1 + dem2.
The following operations are possible using GridObjects:
Equality Check:
==Inequality Check:
!=Greater Than:
>Less Than:
<Greater Than or Equal To:
>=Less Than or Equal To:
<=Addition:
+Subtraction:
-Multiplication:
*Division:
/Logical AND:
&Logical OR:
|Logical XOR:
^Length:
len()Iteration:
for i in dem:Item Access:
y = dem[x]Item Assignment:
dem[x] = yArray Representation: Passing the GridObject in places where a numpy.ndarray is expected
String Representation:
print(dem)
[1]:
import topotoolbox as topo
import matplotlib.pyplot as plt
from mpl_toolkits.axes_grid1 import make_axes_locatable
import numpy as np
Iterating through a GridObject:#
[2]:
dem = topo.gen_random_bool(rows=4, columns=4)

# looping through a GridObject
for i in dem:
    print(i)

# Accessing cells of an GridObject
print(f"\n{dem[2][2]}")
dem[2][2] = 2
print(f"\n{dem[2][2]}")
[0. 1. 0. 1.]
[1. 1. 1. 1.]
[1. 1. 0. 1.]
[1. 0. 0. 0.]

0.0

2.0
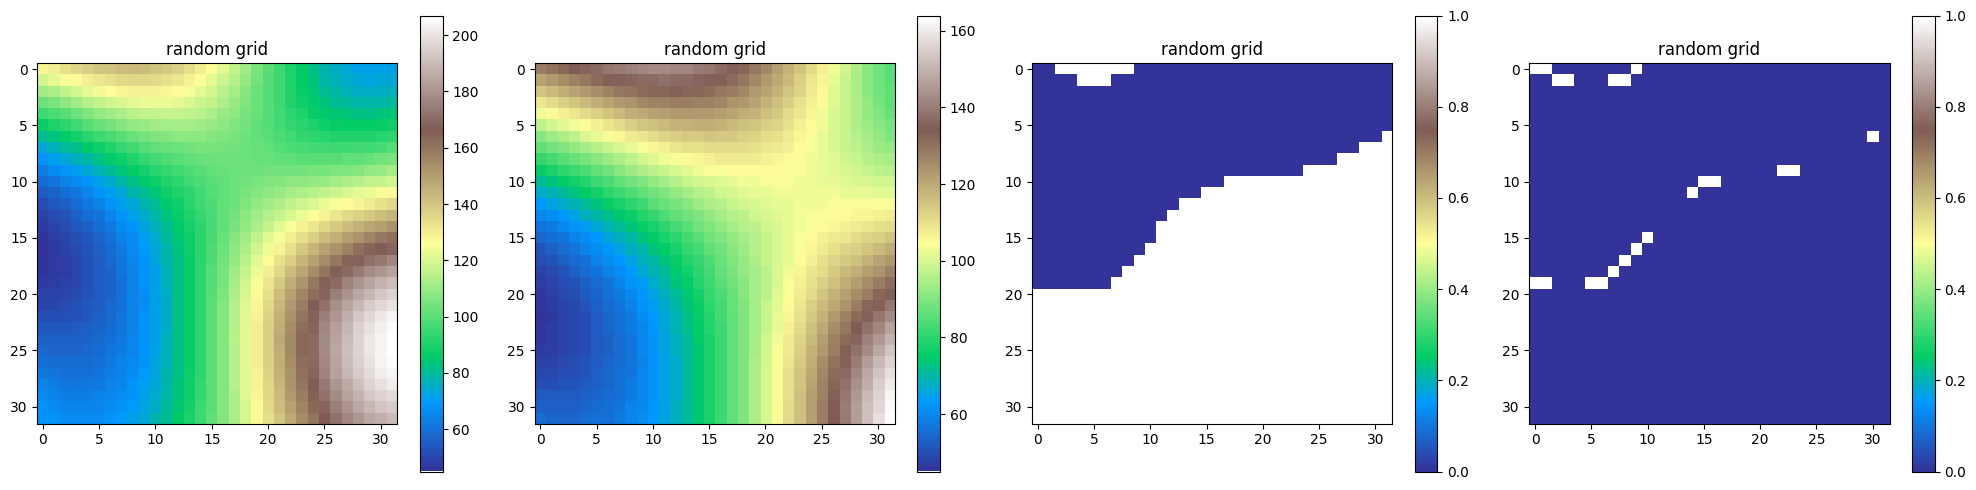
Comparing GridObjects#
[3]:
dem1 = topo.gen_random(rows=32, columns=32, hillsize=24)
dem2 = topo.gen_random(rows=32, columns=32, hillsize=32)

dem3 = dem1 > dem2
dem4 = dem1 == dem2

# Some comparisons between the two generated GridObjects
fig,axs = plt.subplots(1,4,figsize=(20,5),squeeze=False)
img1 = dem1.plot(axs[0,0],cmap="terrain")
div1 = make_axes_locatable(axs[0,0])
cax1 = div1.append_axes("right", size="5%", pad=0.05)
fig.colorbar(img1,cax=cax1)

img2 = dem2.plot(axs[0,1],cmap="terrain")
div2 = make_axes_locatable(axs[0,1])
cax2 = div2.append_axes("right", size="5%", pad=0.05)
fig.colorbar(img2,cax=cax2)

img3 = dem3.plot(axs[0,2],cmap="Greys")
div3 = make_axes_locatable(axs[0,2])
cax3 = div3.append_axes("right", size="5%", pad=0.05)
fig.colorbar(img3,cax=cax3)

img4 = dem4.plot(axs[0,3],cmap="Greys")
div4 = make_axes_locatable(axs[0,3])
cax4 = div4.append_axes("right", size="5%", pad=0.05)
fig.colorbar(img4,cax=cax4)

plt.tight_layout()
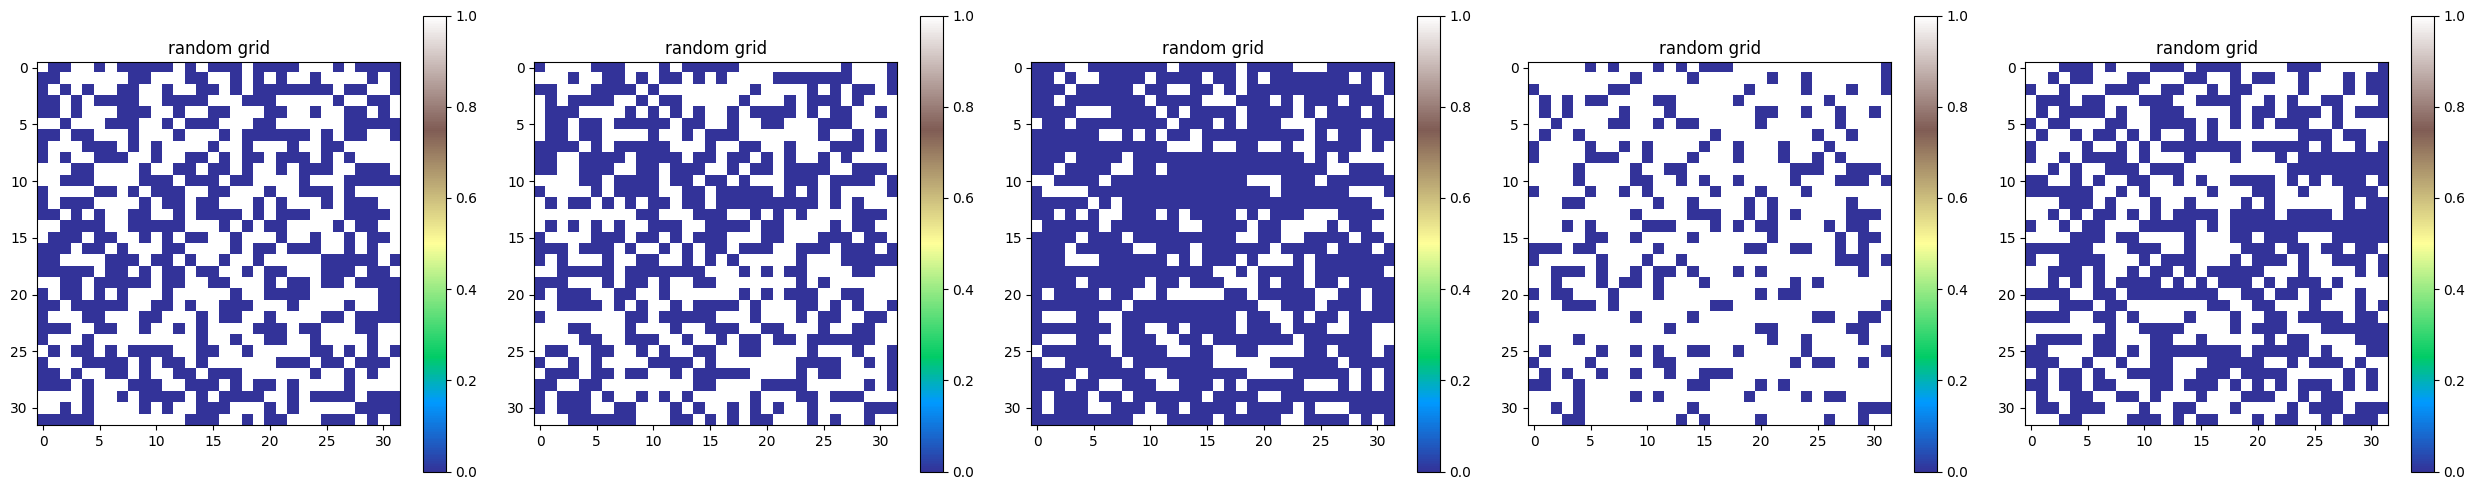
Using AND, OR as well as XOR#
[4]:
dem1 = topo.gen_random_bool()
dem2 = topo.gen_random_bool()

dem3 = dem1 & dem2
dem4 = dem1 | dem2
dem5 = dem1 ^ dem2

fig,axs = plt.subplots(1,5,figsize=(25,5),squeeze=False)
img1 = dem1.plot(axs[0,0],cmap="Greys")
div1 = make_axes_locatable(axs[0,0])
cax1 = div1.append_axes("right", size="5%", pad=0.05)
fig.colorbar(img1,cax=cax1)

img2 = dem2.plot(axs[0,1],cmap="Greys")
div2 = make_axes_locatable(axs[0,1])
cax2 = div2.append_axes("right", size="5%", pad=0.05)
fig.colorbar(img2,cax=cax2)

img3 = dem3.plot(axs[0,2],cmap="Greys")
div3 = make_axes_locatable(axs[0,2])
cax3 = div3.append_axes("right", size="5%", pad=0.05)
fig.colorbar(img3,cax=cax3)

img4 = dem4.plot(axs[0,3],cmap="Greys")
div4 = make_axes_locatable(axs[0,3])
cax4 = div4.append_axes("right", size="5%", pad=0.05)
fig.colorbar(img4,cax=cax4)

img5 = dem4.plot(axs[0,4],cmap="Greys")
div5 = make_axes_locatable(axs[0,4])
cax5 = div5.append_axes("right", size="5%", pad=0.05)
fig.colorbar(img5,cax=cax5)

plt.tight_layout()
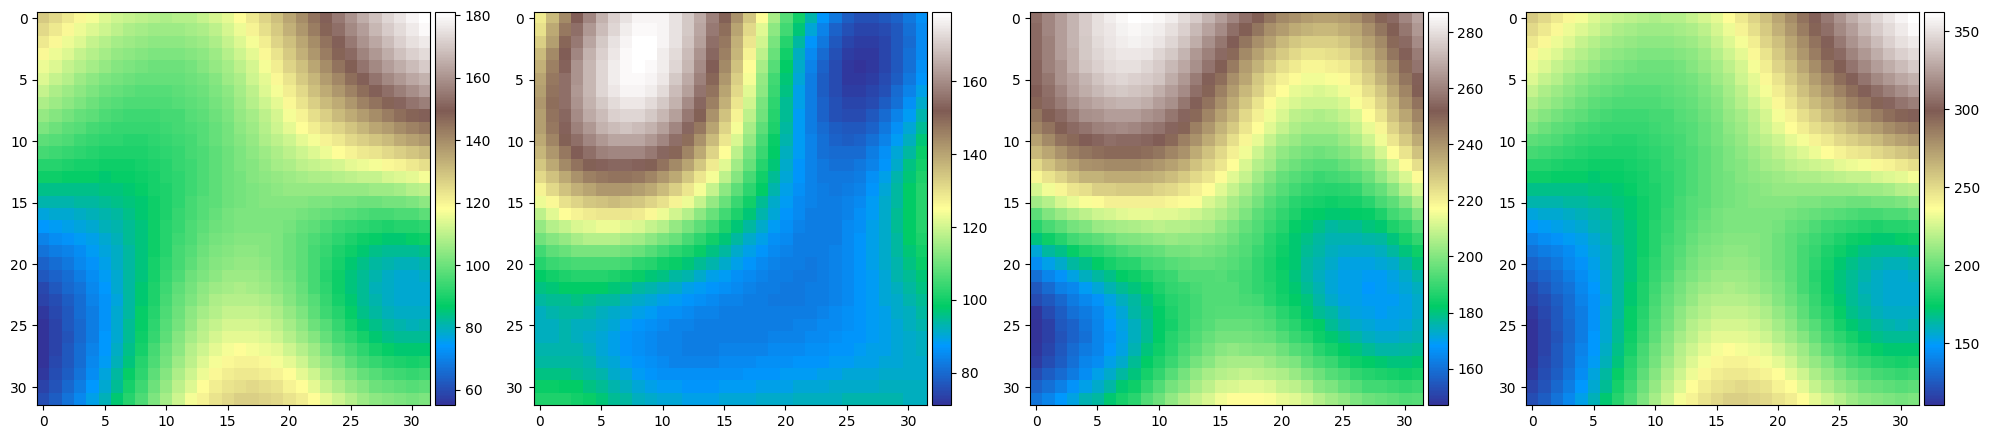
[5]:
dem1 = topo.gen_random(rows=32, columns=32, seed=128, name='dem1')
dem2 = topo.gen_random(rows=32, columns=32, seed=84, name='dem2')

dem3 = dem1 + dem2
dem4 = dem1 * 2

# Adding two GridObject together and multiplying dem1 by 2. Notice the colorbar
fig,axs = plt.subplots(1,4,figsize=(20,5),squeeze=False)
img1 = dem1.plot(axs[0,0],cmap="terrain")
div1 = make_axes_locatable(axs[0,0])
cax1 = div1.append_axes("right", size="5%", pad=0.05)
fig.colorbar(img1,cax=cax1)

img2 = dem2.plot(axs[0,1],cmap="terrain")
div2 = make_axes_locatable(axs[0,1])
cax2 = div2.append_axes("right", size="5%", pad=0.05)
fig.colorbar(img2,cax=cax2)

img3 = dem3.plot(axs[0,2],cmap="terrain")
div3 = make_axes_locatable(axs[0,2])
cax3 = div3.append_axes("right", size="5%", pad=0.05)
fig.colorbar(img3,cax=cax3)

img4 = dem4.plot(axs[0,3],cmap="terrain")
div4 = make_axes_locatable(axs[0,3])
cax4 = div4.append_axes("right", size="5%", pad=0.05)
fig.colorbar(img4,cax=cax4)

plt.tight_layout()