topotoolbox.GridObject#
- class topotoolbox.GridObject[source]#
Bases:
objectA class containing all information of a Digital Elevation Model (DEM).
Methods
__init__()Initialize a GridObject instance.
aspect([classify])Aspect returns the slope exposition of each cell in a digital elevation model in degrees.
astype(dtype)Copy of the GridObject, cast to specified type
auxiliary_topography([bc, hybrid])Compute auxiliary topography
crop(left, right, top, bottom, mode)Crop the Gridobject by specifying new boundaries.
curvature([ctype, meanfilt])curvature returns the second numerical derivative (curvature) of a digital elevation model.
dilate([size, footprint, structure])A simple wrapper around th scipy.ndimage.grey_dilation function, that also handles NaNs in the input GridObject.
duplicate_with_new_data(data)Duplicate a GridObject with different data
erode([size, footprint, structure])Apply a morphological erosion operation to the GridObject.
evansslope([partial_derivatives, mode, modified])Evans method fits a second-order polynomial to 3x3 subgrids.
excesstopography([threshold, method])Compute the two-dimensional excess topography using the specified method.
fillsinks([bc, hybrid])Fill sinks in the digital elevation model (DEM).
filter([method, kernelsize])The function filter is a wrapper around various image filtering algorithms.
gradient8([unit, multiprocessing])Compute the gradient of a digital elevation model (DEM) using an 8-direction algorithm.
hillshade([azimuth, altitude, exaggerate, fused])Compute a hillshade of a digital elevation model
identifyflats([raw, output])Identifies flats and sills in a digital elevation model (DEM).
info()Prints all variables of a GridObject.
plot([ax, extent])Plot the GridObject
plot_hs([ax, elev, azimuth, altitude, ...])Plot a shaded relief map of the GridObject
plot_surface([ax])Plot DEM as a 3D surface
prominence(tolerance[, use_hybrid])This function calculates the prominence of peaks in a DEM.
reproject(georef[, resolution, resampling])Reproject GridObject to a new coordinate system.
resample(resolution[, resampling])Resample GridObject to a new resolution.
shufflelabel([seed])Randomize the labels of a GridObject
zscore([dtype])Returns the z-score for each element of GridObject such that all values are centered to have mean 0 and scaled to have standard deviation 1.
Attributes
The size of the second dimension of the grid
Coordinate arrays for the DEM
The dimensions of the grid in the correct order for libtopotoolbox
The bounding box of the grid in the order needed for plotting
The size of the first dimension of the grid
Tuple of grid dimensions
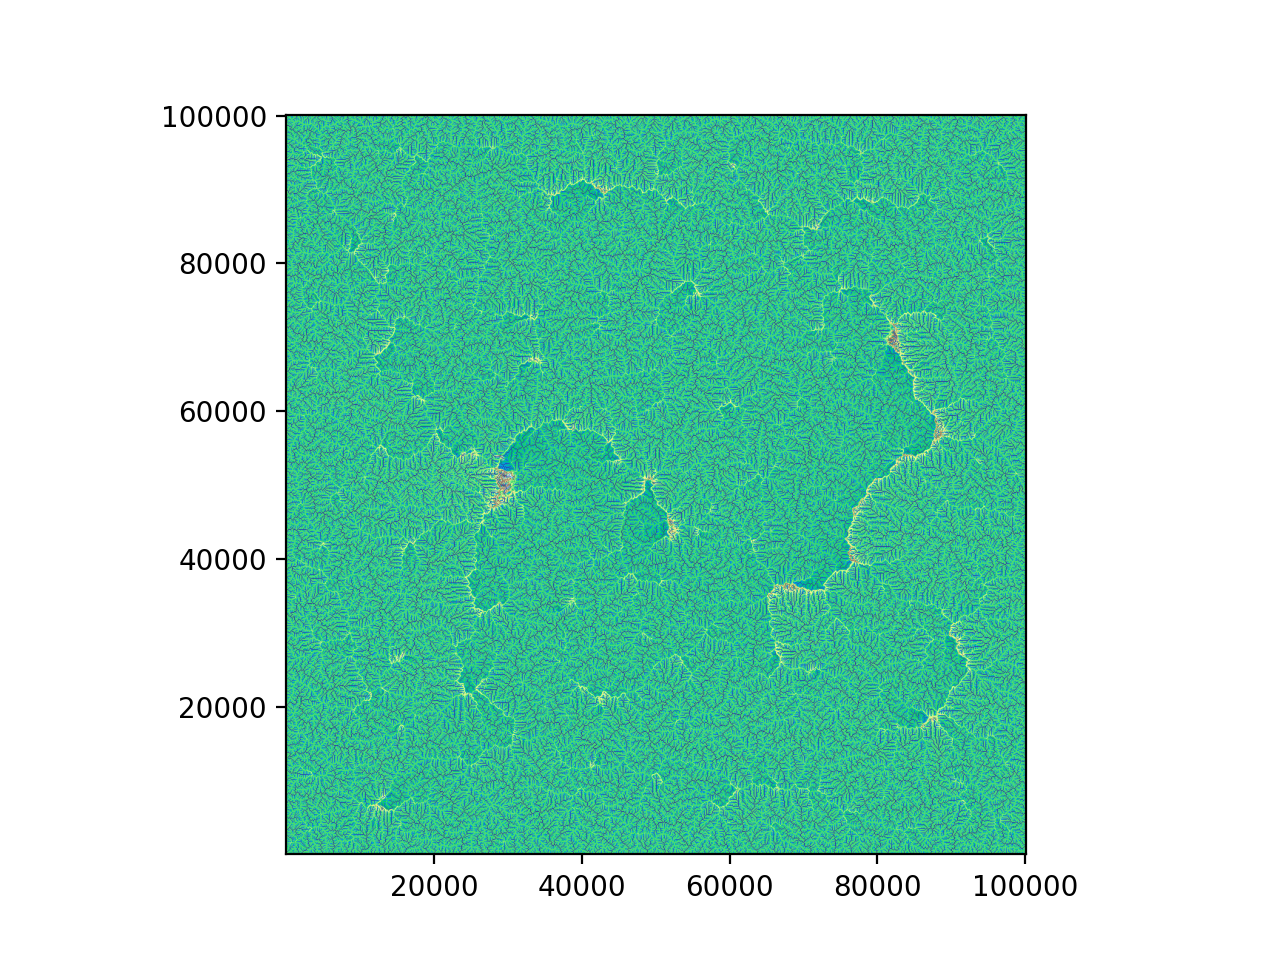
- aspect(classify: bool = False) GridObject[source]#
Aspect returns the slope exposition of each cell in a digital elevation model in degrees. In contrast to the second output of gradient8 which returns the steepest slope direction, aspect returns the angle of the slope.
- Parameters:
classify (bool, optional) – directions are classified according to the scheme proposed by Gomez-Plaza et al. (2001), by default False
- Returns:
A GridObject containing the computed aspect data.
- Return type:
Example
>>> import topotoolbox
>>> import matplotlib.pyplot as plt
>>> dem = topotoolbox.load_dem('perfectworld')
>>> aspect = dem.aspect()
>>> _= aspect.plot(cmap='terrain')
>>> plt.show()
(
Source code,png,hires.png,pdf)
- astype(dtype)[source]#
Copy of the GridObject, cast to specified type
- Parameters:
dtype (str or np.dtype) – The numpy data type to which the GridObject is cast
- Returns:
A copy of the original GridObject with the given data type
- Return type:
Example
>>> import topotoolbox
>>> import numpy as np
>>> dem = topotoolbox.load_dem('perfectworld')
>>> dem = dem.astype(np.float32)
- auxiliary_topography(bc=None, hybrid=True)[source]#
Compute auxiliary topography
This is used for least-cost auxiliary topography flow routing.
- Returns:
(aux – The auxiliary topography, sink-filled DEM and an array identifying flats in the sink-filled DEM.
- Return type:
np.ndarray, filled_dem: np.ndarray, flats: np.ndarray)
- property columns#
The size of the second dimension of the grid
- property coordinates#
Coordinate arrays for the DEM
- Returns:
X,Y (tuple of ndarrays) – The two returned arrays are of the same shape as the
DEM. The first contains the coordinates of each pixel in the
horizontal dimension, and the second contains the coordinates
in the vertical dimension.
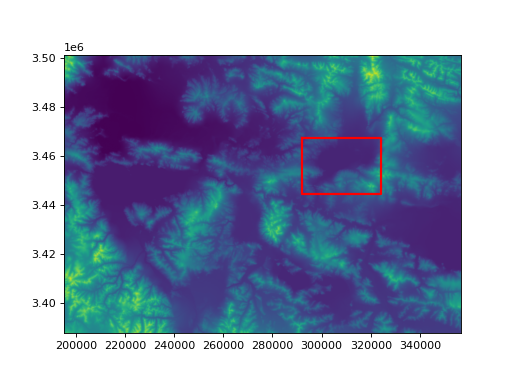
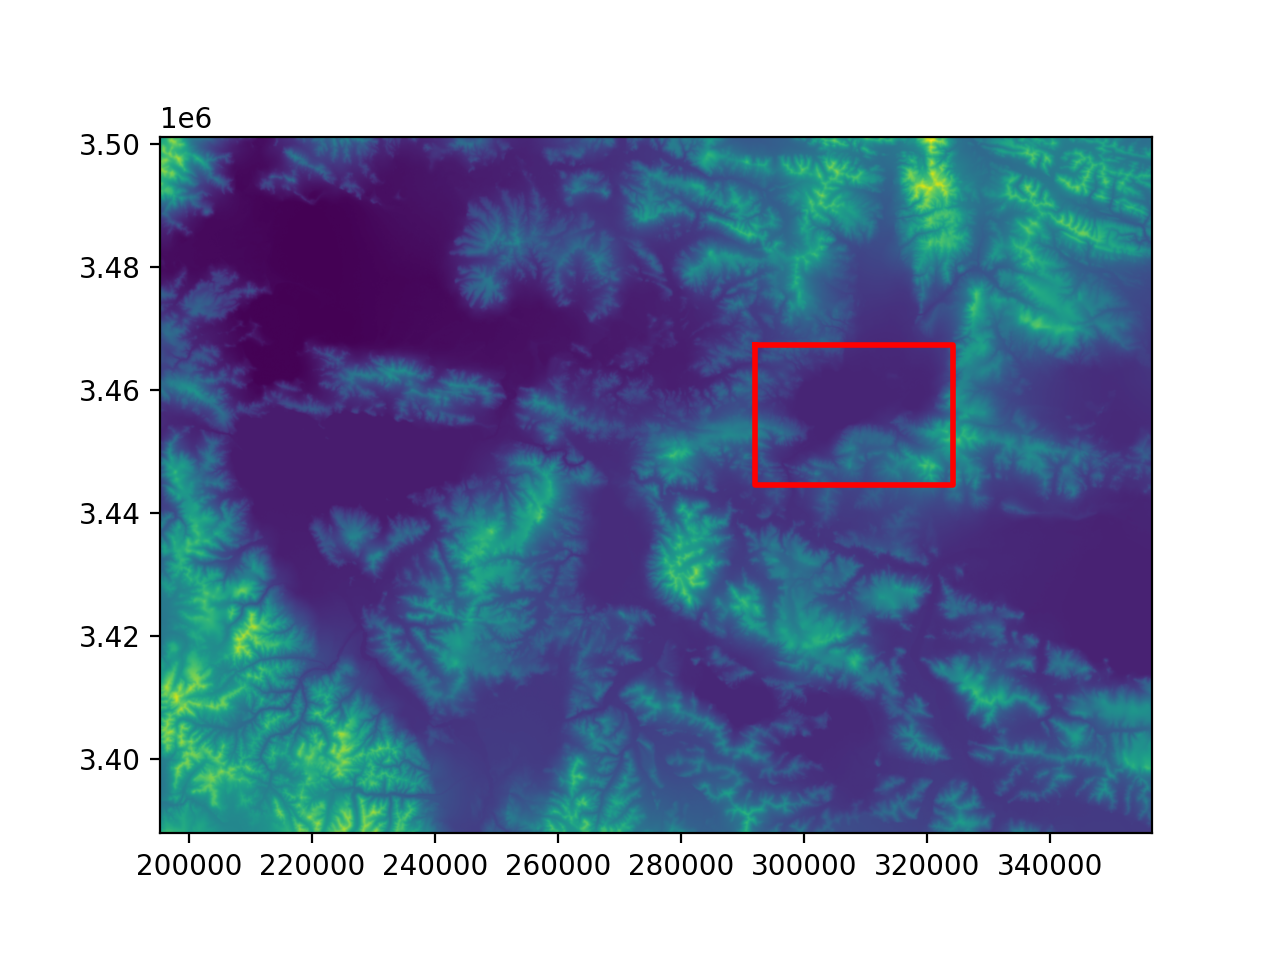
- crop(left: float | int, right: float | int, top: float | int, bottom: float | int, mode: str) GridObject[source]#
Crop the Gridobject by specifying new boundaries.
Supports three input modes (percent, coordinate, pixel) to define the crop region. Method of crop has to be chosen by using the mode argument. In case of reversed boundaries, automatically swaps them to ensure the crop region is valid. The resulting grid will have a new transform and bounds based on the specified boundaries.
- Parameters:
left (float or int) – Left boundary in one of three modes: - Percent: 0.0 to 1.0 (relative to grid width) - Coordinate: Within grid’s horizontal bounds - Pixel: Column index (0 to grid width-1)
right (float or int) – Right boundary (same modes as left).
top (float or int) – Top boundary in one of three modes: - Percent: 0.0-1.0 (relative to grid height) - Coordinate: Within grid’s vertical bounds - Pixel: Row index (0 to grid height-1)
bottom (float or int) – Bottom boundary (same modes as top).
mode (str) – The mode of the crop operation. Can be ‘percent’, ‘coordinate’, or ‘pixel’.
- Returns:
Cropped grid with updated transform, bounds, and data.
- Return type:
- Raises:
ValueError – If boundaries are not in a consistent valid mode.
Example
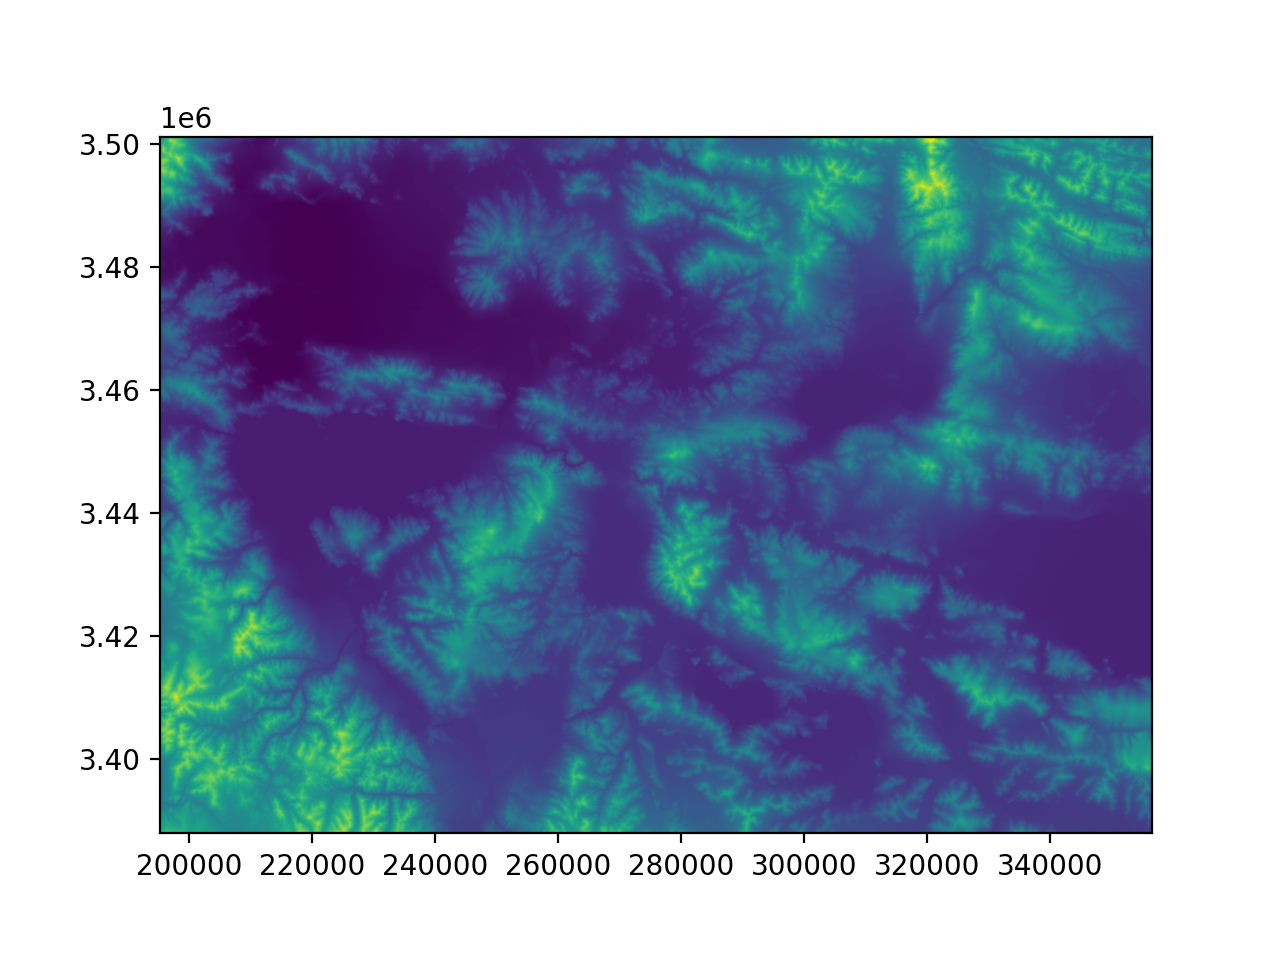
>>> import topotoolbox
>>> import matplotlib.pyplot as plt
>>> dem = topotoolbox.load_dem('tibet')
>>> new_dem = dem.crop(0.6, 0.8, 0.3, 0.5, 'percent')
>>> _= dem.plot()
>>> b = new_dem.bounds
>>> _= plt.plot(
...             [b.left, b.right, b.right, b.left, b.left],
...             [b.top, b.top, b.bottom, b.bottom, b.top],'r-', lw=2
... )
>>> plt.show()
(
Source code,png,hires.png,pdf)
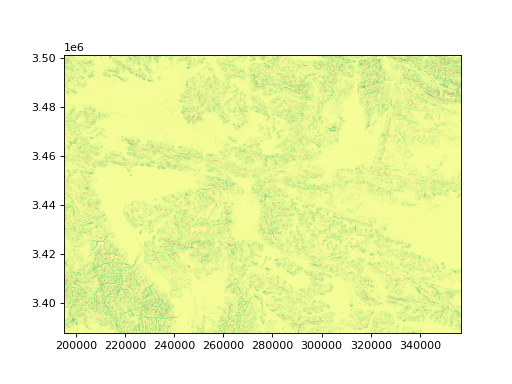
- curvature(ctype='profc', meanfilt=False) GridObject[source]#
curvature returns the second numerical derivative (curvature) of a digital elevation model. By default, curvature returns the profile curvature (profc).
- Parameters:
ctype (str, optional) – What type of curvature will be computed, by default ‘profc’ - ‘profc’ : profile curvature [m^(-1)], - ‘planc’ : planform curvature [m^(-1))], - ‘tangc’ : tangential curvature [m^(-1)], - ‘meanc’ : mean curvature [m^(-1)], - ‘total’ : total curvature [m^(-2)]
meanfilt (bool, optional) – True if a mean filter will be applied before comuting the curvature, by default False
- Returns:
A GridObject storing the computed values.
- Return type:
- Raises:
ValueError – If wrong ctype has been used.
Examples
>>> import topotoolbox
>>> import matplotlib.pyplot as plt
>>> dem = topotoolbox.load_dem('tibet')
>>> curv = dem.curvature()
>>> _= curv.plot(cmap='terrain')
>>> plt.show()
(
Source code,png,hires.png,pdf)
- dilate(size: tuple | None = None, footprint: ndarray | None = None, structure: ndarray | None = None) GridObject[source]#
A simple wrapper around th scipy.ndimage.grey_dilation function, that also handles NaNs in the input GridObject. Either size, footprint or structure has to be passed to this function. If nothing is provided, the function will raise an error.
- sizetuple of ints, optional
A tuple of ints containing the shape of the structuring element. Only needed if neither footprint nor structure is provided. Will result in a full and flat structuring element. Defaults to None
- footprintnp.ndarray of ints, optional
A array defining the footprint of the erosion operation. Non-zero elements define the neighborhood over which the erosion is applied. Defaults to None
- structurenp.ndarray of ints, optional
A array defining the structuring element used for the erosion. This defines the connectivity of the elements. Defaults to None
- Returns:
A GridObject storing the computed values.
- Return type:
- Raises:
ValueError – If size, structure and footprint are all None.
Example
>>> import topotoolbox
>>> import matplotlib.pyplot as plt
>>> dem = topotoolbox.load_dem('perfectworld')
>>> dilate = dem.dilate(size=10)
>>> _= dilate.plot(cmap='terrain')
>>> plt.show()
(
Source code,png,hires.png,pdf)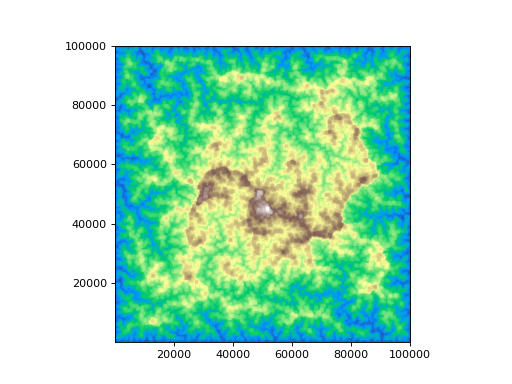
- property dims#
The dimensions of the grid in the correct order for libtopotoolbox
- duplicate_with_new_data(data: ndarray) GridObject[source]#
Duplicate a GridObject with different data
This function is helpful when one wants to create a GridObject from a numpy array with the exact same properties (e.g. georef, …) but different data
- Parameters:
data (np.ndarray) – The new data (needs to be in the same shape than the current GridObject)
- Returns:
A grid identical to the input, but with new data.
- Return type:
Example
>>> import topotoolbox
>>> dem = topotoolbox.load_dem('perfectworld')
>>> new_dem = dem.duplicate_with_new_data(np.zeros(dem.shape))
- erode(size: tuple | None = None, footprint: ndarray | None = None, structure: ndarray | None = None) GridObject[source]#
Apply a morphological erosion operation to the GridObject. Either size, footprint or structure has to be passed to this function. If nothing is provided, the function will raise an error.
- Parameters:
size (tuple of ints) – A tuple of ints containing the shape of the structuring element. Only needed if neither footprint nor structure is provided. Will result in a full and flat structuring element. Defaults to None
footprint (np.ndarray of ints, optional) – A array defining the footprint of the erosion operation. Non-zero elements define the neighborhood over which the erosion is applied. Defaults to None
structure (np.ndarray of ints, optional) – A array defining the structuring element used for the erosion. This defines the connectivity of the elements. Defaults to None
- Returns:
A GridObject storing the computed values.
- Return type:
- Raises:
ValueError – If size, structure and footprint are all None.
Example
>>> import topotoolbox
>>> import matplotlib.pyplot as plt
>>> dem = topotoolbox.load_dem('perfectworld')
>>> eroded = dem.erode(size = (3,3))
>>> _= eroded.plot(cmap='terrain')
>>> plt.show()
(
Source code,png,hires.png,pdf)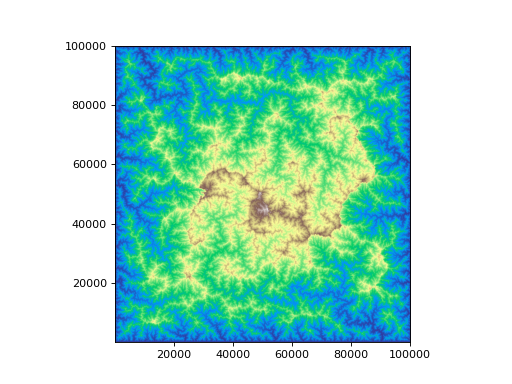
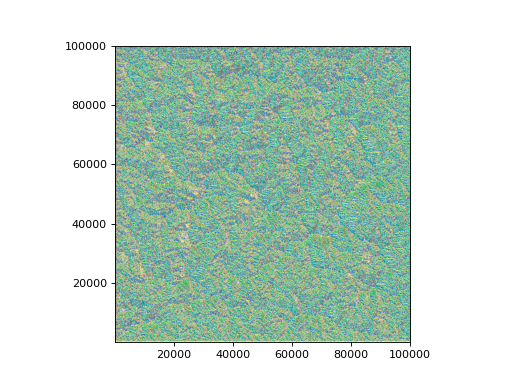
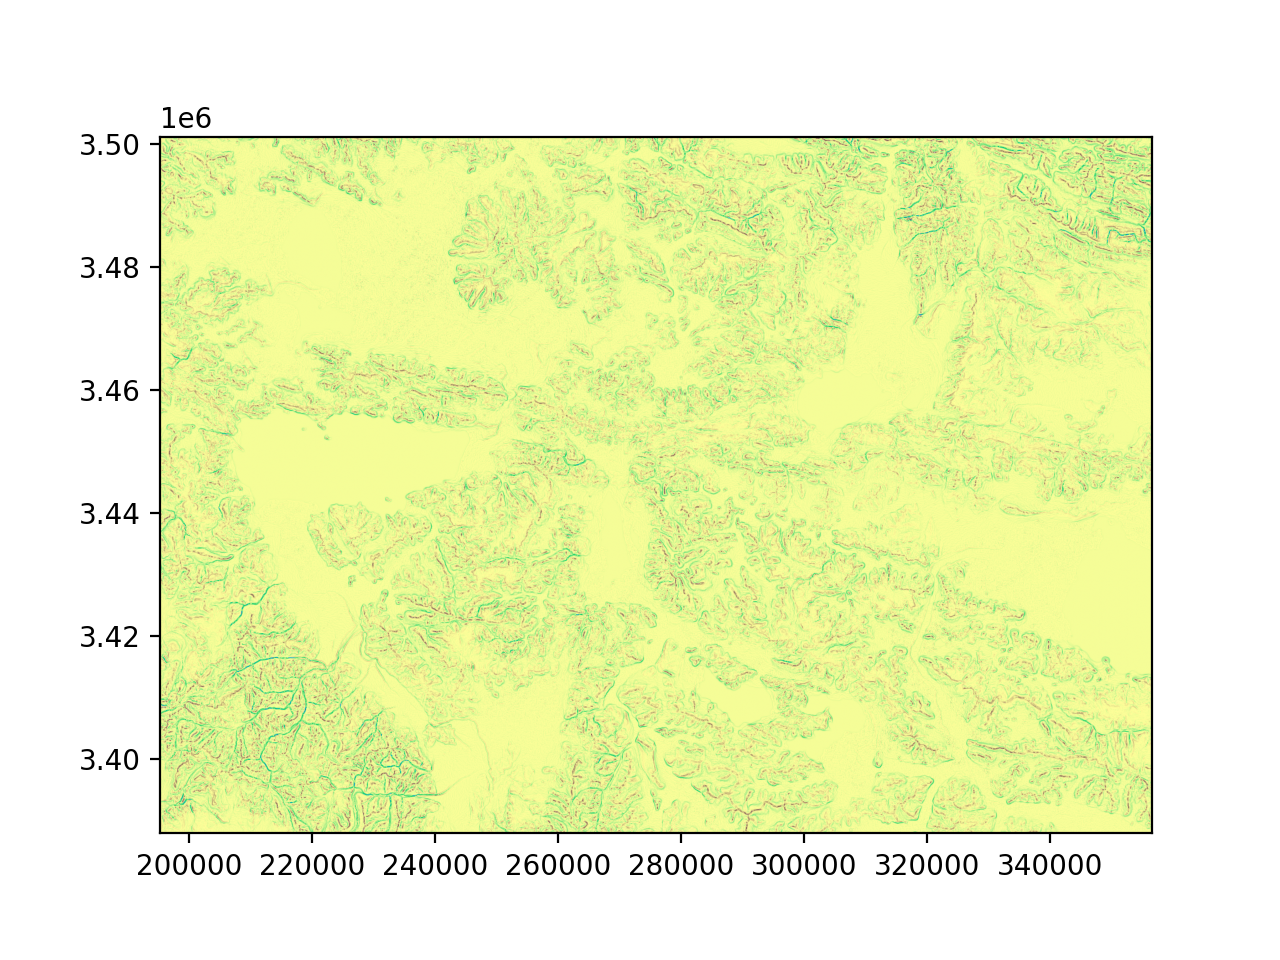
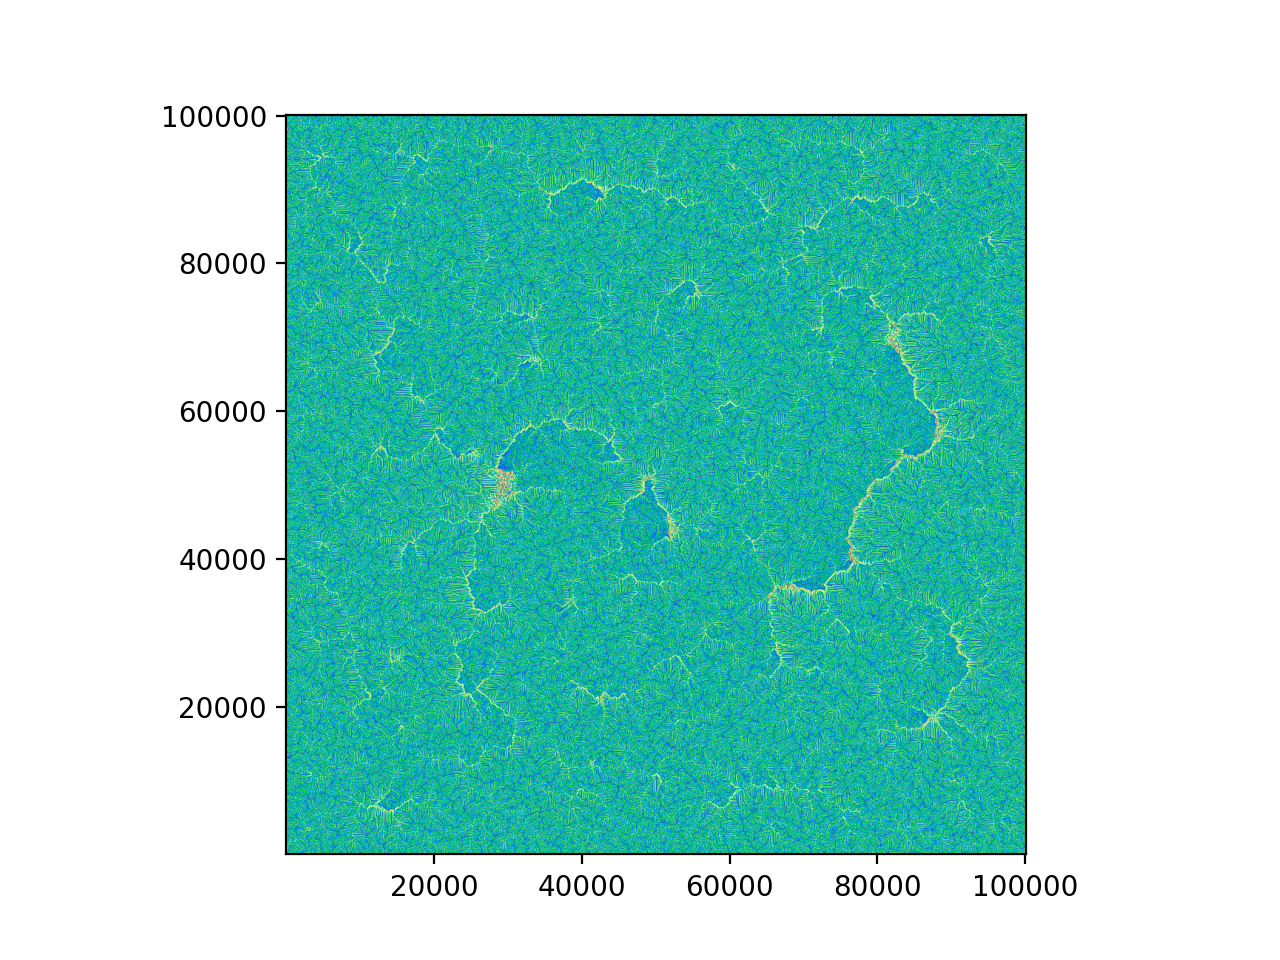
- evansslope(partial_derivatives: bool = False, mode: str = 'nearest', modified: bool = False) GridObject | Tuple[GridObject, GridObject][source]#
Evans method fits a second-order polynomial to 3x3 subgrids. The parameters of the polynomial are the partial derivatives which are used to calculate the surface slope = sqrt(Gx**2 + Gy**2).
Evans method approximates the surface by regression surfaces. Gradients are thus less susceptible to noise in the DEM.
- Parameters:
mode (str, optional) – The mode parameter determines how the input DEM is extended beyond its boundaries: [‘reflect’, ‘constant’, ‘nearest’, ‘mirror’, ‘wrap’, ‘grid-mirror’, ‘grid-constant’, ‘grid-wrap’]. See scipy.ndimage.convolve for more information, by default ‘nearest’
modified (bool, optional) – If True, the surface is weakly smoothed before gradients are calculated (see Shary et al., 2002), by default False
partial_derivatives (bool, optional) – If True, both partial derivatives [fx, fy] will be returned as GridObjects instead of just the evansslope, by default False
- Returns:
A GridObject containing the computed evansslope data.
- Return type:
Example
>>> import topotoolbox
>>> import matplotlib.pyplot as plt
>>> dem = topotoolbox.load_dem('perfectworld')
>>> slope = dem.evansslope()
>>> _= slope.plot(cmap='terrain')
>>> plt.show()
(
Source code,png,hires.png,pdf)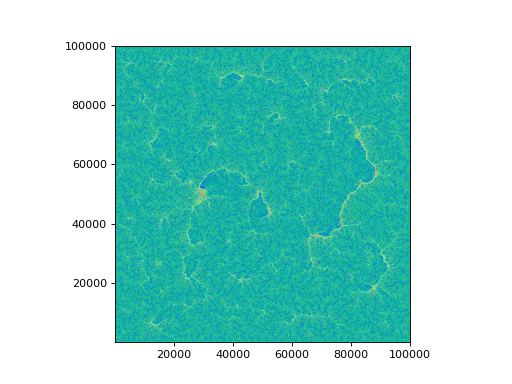
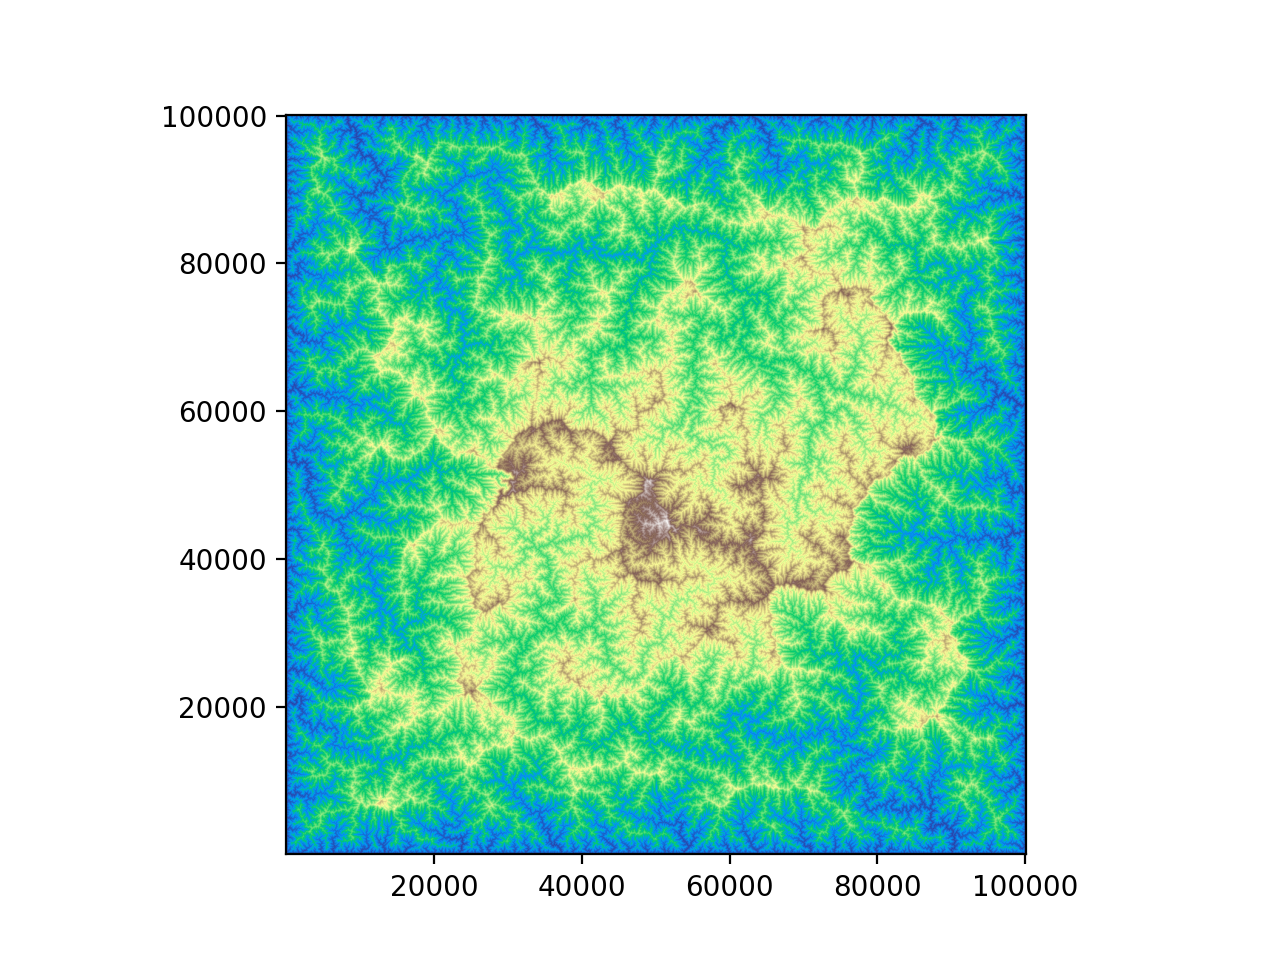
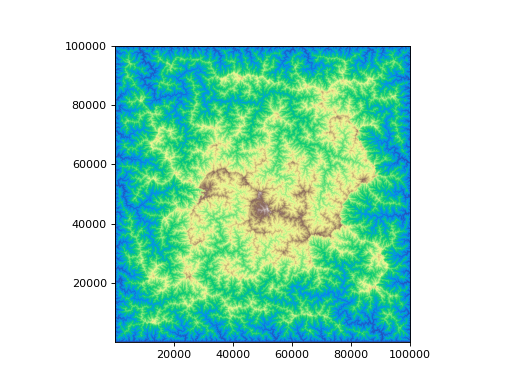
- excesstopography(threshold: float | int | ndarray | GridObject = 0.2, method: str = 'fsm2d') GridObject[source]#
Compute the two-dimensional excess topography using the specified method.
- Parameters:
threshold (float, int, GridObject, or np.ndarray, optional) – Threshold value or array to determine slope limits, by default 0.2. If a float or int, the same threshold is applied to the entire DEM. If a GridObject or np.ndarray, it must match the shape of the DEM.
method (str, optional) –
Method to compute the excess topography, by default ‘fsm2d’. Options are:
’fsm2d’: Uses the fast sweeping method.
’fmm2d’: Uses the fast marching method.
- Returns:
A new GridObject with the computed excess topography.
- Return type:
- Raises:
ValueError – If method is not one of [‘fsm2d’, ‘fmm2d’]. If threshold is an np.ndarray and doesn’t match the shape of the DEM.
TypeError – If threshold is not a float, int, GridObject, or np.ndarray.
Example
>>> import topotoolbox
>>> import matplotlib.pyplot as plt
>>> dem = topotoolbox.load_dem('perfectworld')
>>> excess = dem.excesstopography(threshold=0.3, method='fsm2d')
>>> _= excess.plot(cmap='terrain')
>>> plt.show()
(
Source code,png,hires.png,pdf)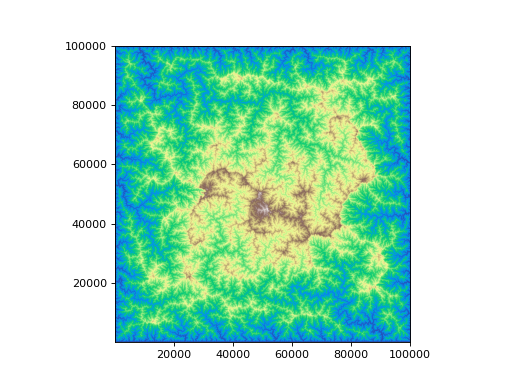
- property extent#
The bounding box of the grid in the order needed for plotting
- Returns:
The bounding box in the order (left, right, bottom, top)
- Return type:
tuple
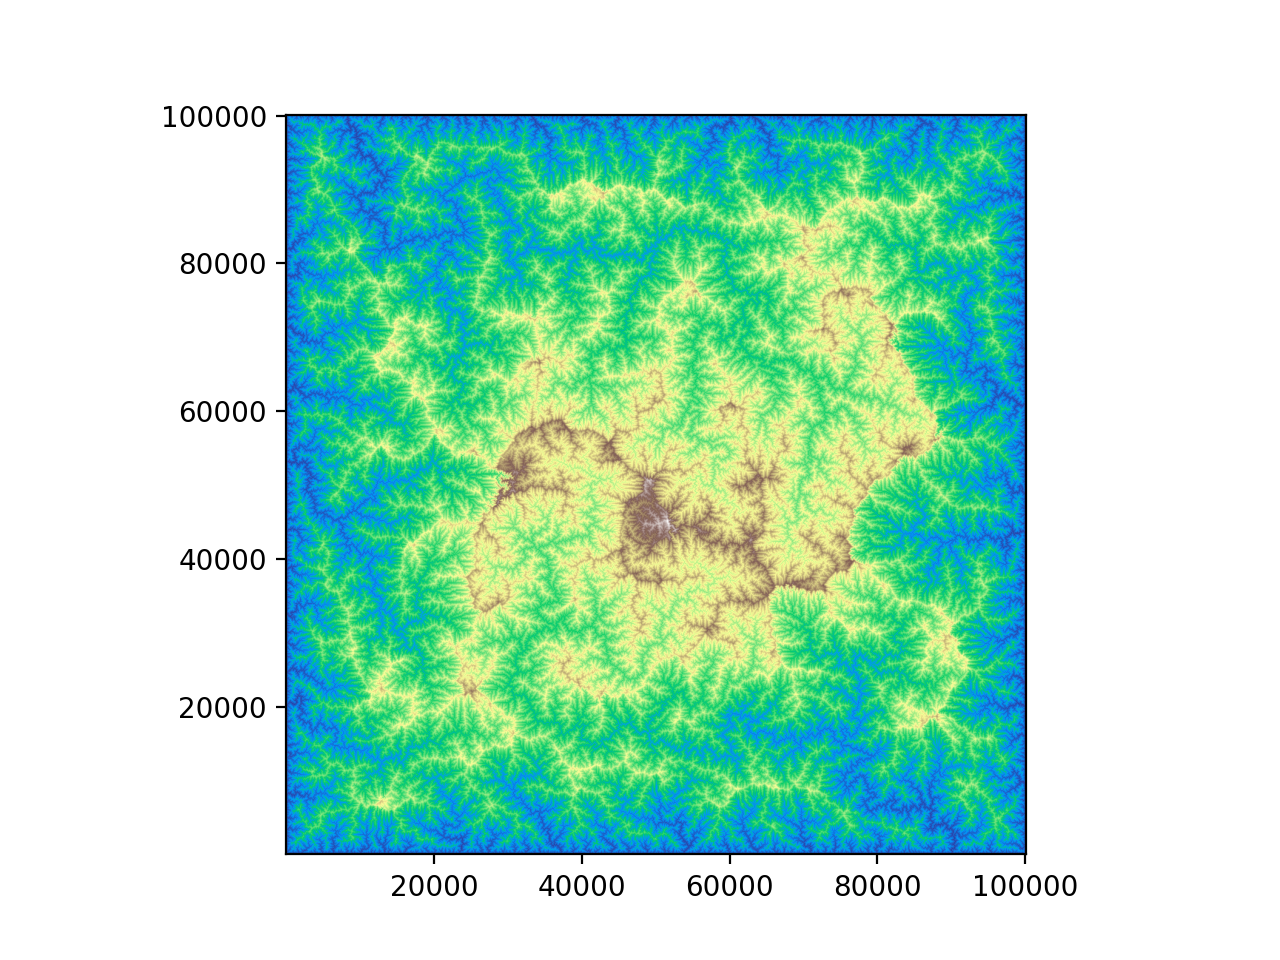
- fillsinks(bc: ndarray | GridObject | None = None, hybrid: bool = True) GridObject[source]#
Fill sinks in the digital elevation model (DEM).
- Parameters:
bc (ndarray or GridObject, optional) – Boundary conditions for sink filling. bc should be an array of np.uint8 that matches the shape of the DEM. Values of 1 indicate pixels that should be fixed to their values in the original DEM and values of 0 indicate pixels that should be filled.
hybrid (bool, optional) – Should hybrid reconstruction algorithm be used? Defaults to True. Hybrid reconstruction is faster but requires additional memory be allocated for a queue.
- Returns:
The filled DEM.
- Return type:
Example
>>> import topotoolbox
>>> import matplotlib.pyplot as plt
>>> dem = topotoolbox.load_dem('perfectworld')
>>> filled_dem = dem.fillsinks()
>>> _= filled_dem.plot(cmap='terrain')
>>> plt.show()
(
Source code,png,hires.png,pdf)
- filter(method: str = 'mean', kernelsize: int = 3) GridObject[source]#
The function filter is a wrapper around various image filtering algorithms. Only filters with rectangular kernels of uneven dimensions are supported.
- Parameters:
method (str, optional) – Which method will be used to filter the DEM: [‘mean’, ‘average’, ‘median’, ‘sobel’, ‘scharr’, ‘wiener’, ‘std’], by default ‘mean’
kernelsize (int, optional) – Size of the kernel that will be applied. Note that [‘sobel’, ‘scharr’] require that the kernelsize is 3, by default 3
- Returns:
The filtered DEM as a GridObject.
- Return type:
- Raises:
ValueError – If the kernelsize does not match the requirements of this function or the selected method is not implemented in the function.
Example
>>> import topotoolbox
>>> import matplotlib.pyplot as plt
>>> dem = topotoolbox.load_dem('perfectworld')
>>> scharr = dem.filter(method='scharr', kernelsize=3)
>>> _= scharr.plot(cmap='terrain')
>>> plt.show()
(
Source code,png,hires.png,pdf)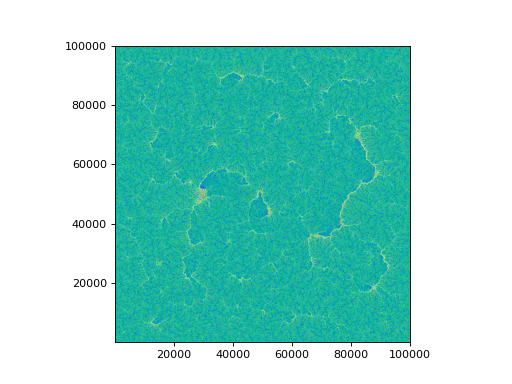
- gradient8(unit: str = 'tangent', multiprocessing: bool = True)[source]#
Compute the gradient of a digital elevation model (DEM) using an 8-direction algorithm.
- Parameters:
unit (str, optional) – The unit of the gradient to be calculated. Options are: - ‘tangent’ : Calculate the gradient as a tangent (default). - ‘radian’ : Calculate the gradient in radians. - ‘degree’ : Calculate the gradient in degrees. - ‘sine’ : Calculate the gradient as the sine of the angle. - ‘percent’ : Calculate the gradient as a percentage.
multiprocessing (bool, optional) – If True, use multiprocessing for computation. Default is True.
- Returns:
A new GridObject with the calculated gradient.
- Return type:
Example
>>> import topotoolbox
>>> import matplotlib.pyplot as plt
>>> dem = topotoolbox.load_dem('perfectworld')
>>> grad = dem.gradient8()
>>> _= grad.plot(cmap='terrain')
>>> plt.show()
(
Source code,png,hires.png,pdf)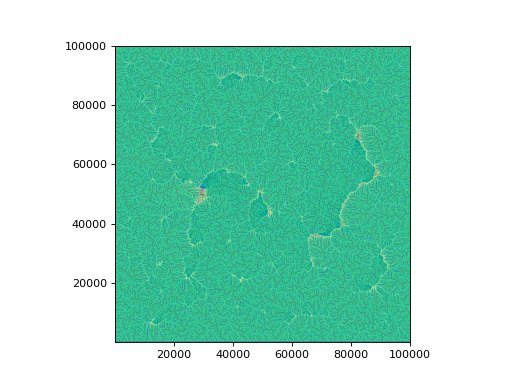
- hillshade(azimuth: float = 315.0, altitude: float = 60.0, exaggerate: float = 1.0, fused=True)[source]#
Compute a hillshade of a digital elevation model
- Parameters:
azimuth (float) – The azimuth angle of the light source measured in degrees clockwise from north. Defaults to 315 degrees.
altitude (float) – The altitude angle of the light source measured in degrees above the horizon. Defaults to 60 degrees.
exaggerate (float) – The amount of vertical exaggeration. Increase to emphasize elevation differences in flat terrain. Defaults to 1.0
fused (bool, optional) – If true, use the fused hillshade computation in libtopotoolbox, which requires less memory but can be slightly slower. If you have a small DEM, and are repeatedly creating hillshades consider setting to False for increased performance. Defaults to True.
- Returns:
A GridObject containing the resulting hillshade data
- Return type:
Example
>>> import topotoolbox
>>> import matplotlib.pyplot as plt
>>> dem = topotoolbox.load_dem('perfectworld')
>>> hillshade = dem.hillshade()
>>> _= hillshade.plot(cmap='gray')
>>> _= dem.plot(cmap='terrain', alpha=0.2)
>>> plt.show()
(
Source code,png,hires.png,pdf)
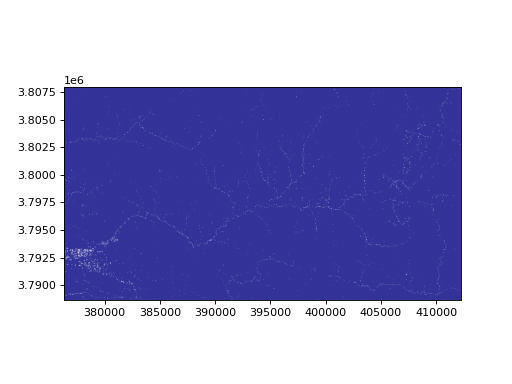
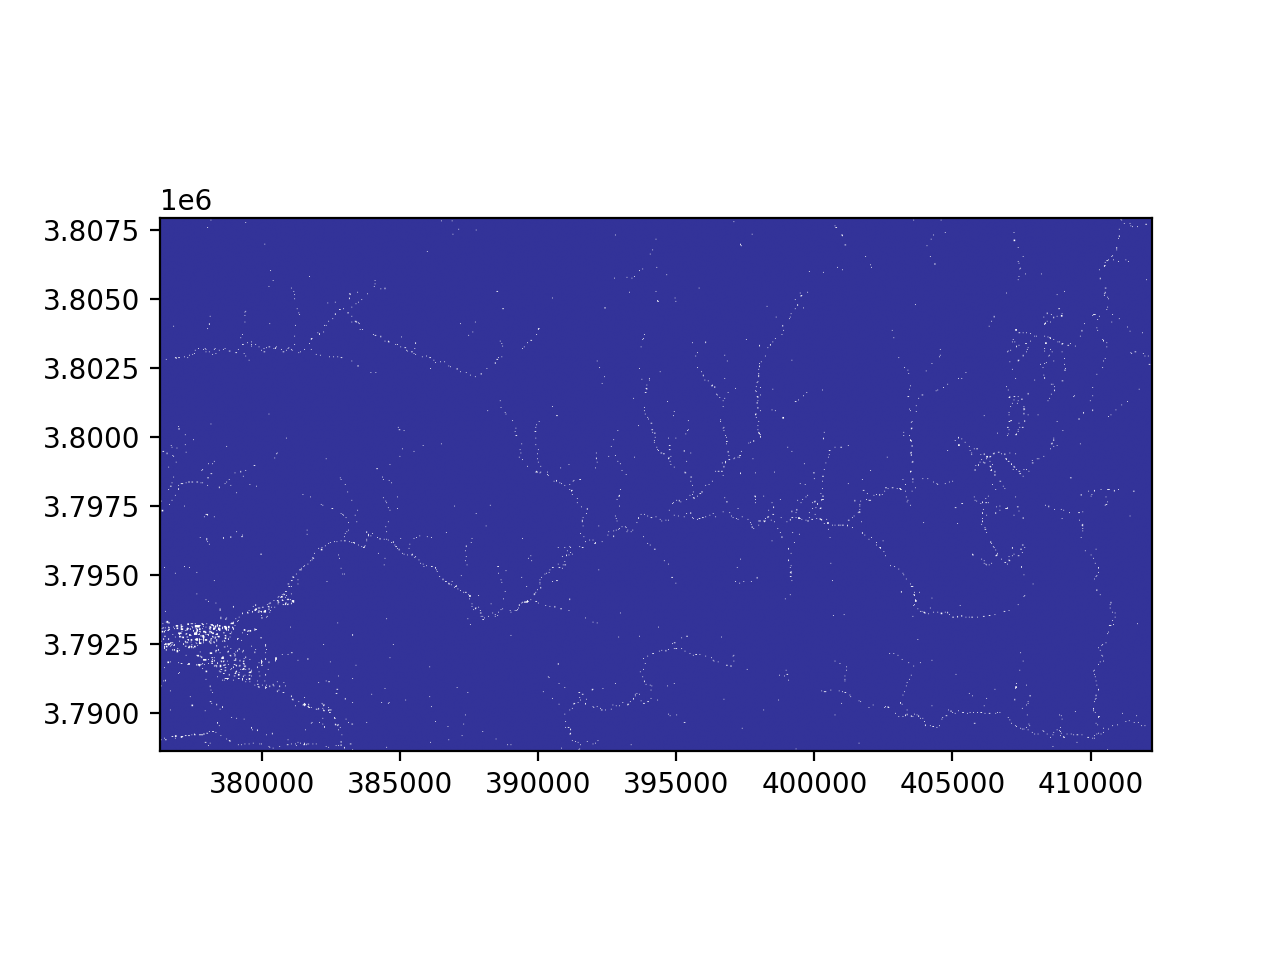
- identifyflats(raw: bool = False, output: list[str] | None = None) tuple[source]#
Identifies flats and sills in a digital elevation model (DEM).
- Parameters:
raw (bool, optional) – If True, returns the raw output grid as np.ndarray. Defaults to False.
output (list of str, optional) – List of strings indicating desired output types. Possible values are ‘sills’, ‘flats’. Order of inputs in list are irrelevant, first entry in output will always be sills. Defaults to [‘sills’, ‘flats’].
- Returns:
A tuple containing copies of the DEM with identified flats and/or sills.
- Return type:
tuple
Notes
Flats are identified as 1s, sills as 2s, and presills as 5s (since they are also flats) in the output grid. Only relevant when using raw=True.
Example
>>> import topotoolbox
>>> import matplotlib.pyplot as plt
>>> dem = topotoolbox.load_dem('bigtujunga')
>>> flats, sills = dem.identifyflats()
>>> _= flats.plot(cmap='terrain')
>>> plt.show()
(
Source code,png,hires.png,pdf)
- plot(ax=None, extent=None, **kwargs)[source]#
Plot the GridObject
- Parameters:
ax (matplotlib.axes.Axes, optional) – The axes in which to plot the GridObject. If no axes are given, the current axes are used.
extent (floats (left, right, bottom, top), optional) – The bounding box used to set the axis limits. If no extent is supplied, defaults to self.extent, which plots the GridObject in geographic coordinates.
**kwargs – Additional keyword arguments are forwarded to matplotlib.axes.Axes.imshow
- Returns:
The image constructed by imshow
- Return type:
matplotlib.image.AxesImage
Example
>>> import topotoolbox
>>> import matplotlib.pyplot as plt
>>> dem = topotoolbox.load_dem('perfectworld')
>>> _= dem.plot(cmap='terrain')
>>> plt.show()
(
Source code,png,hires.png,pdf)
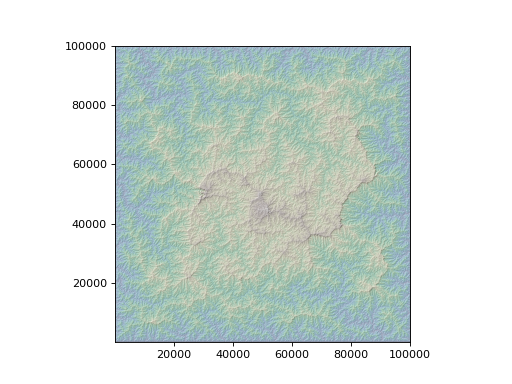
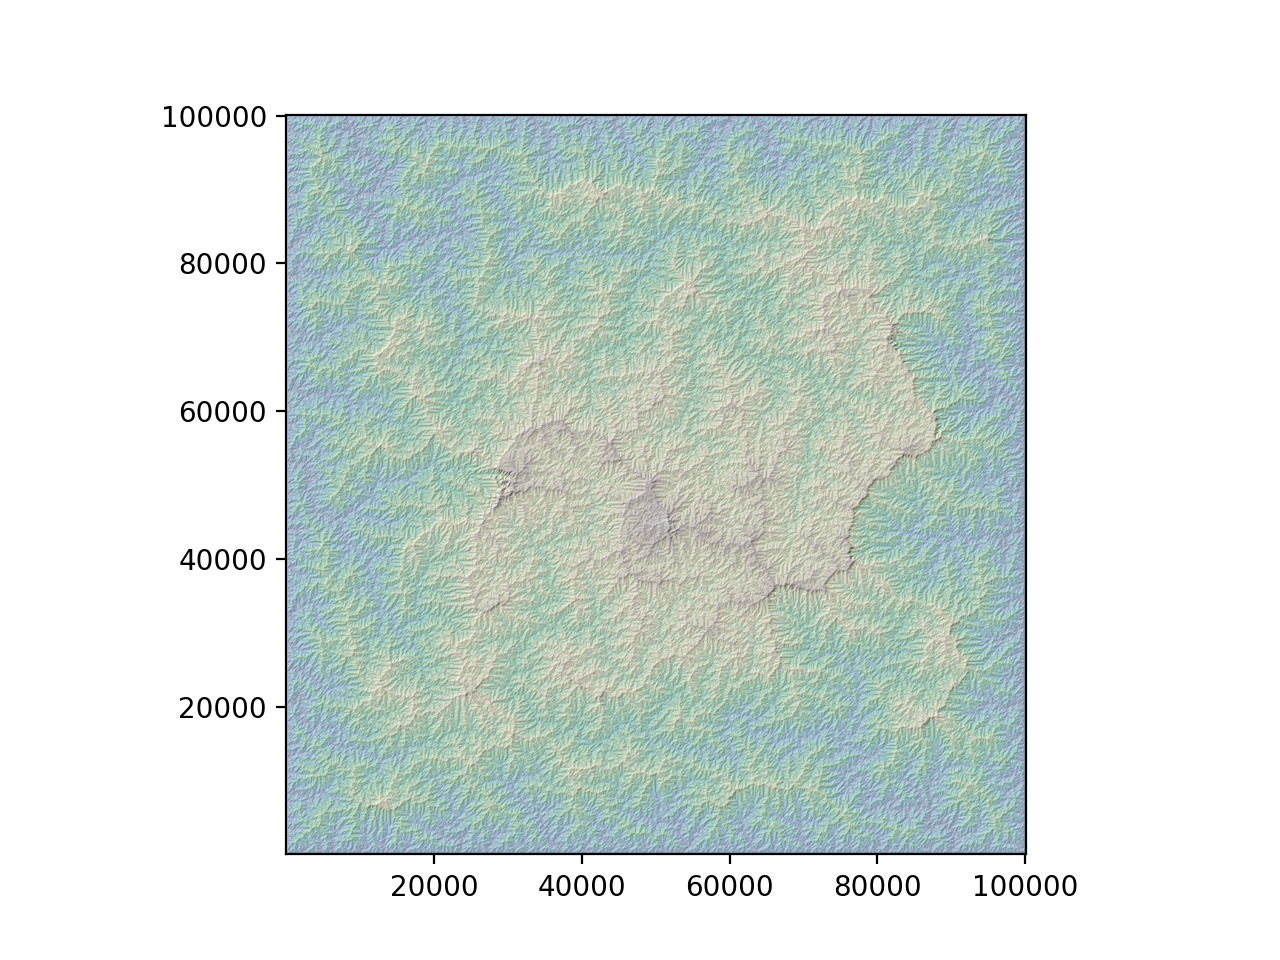
- plot_hs(ax=None, elev=None, azimuth=315, altitude=60, exaggerate=1, filter_method=None, filter_size=3, cmap='terrain', norm=None, blend_mode='soft', extent=None, colorbar=False, **kwargs)[source]#
Plot a shaded relief map of the GridObject
- Parameters:
ax (matplotlib.axes.Axes, optional) – The axes in which to plot the GridObject. If no axes are given, the current axes are used.
elev (GridObject, optional) – The digital elevation model used for shading. If no DEM is provided, the data GridObject is also used for shading.
azimuth (float, optional) – The azimuth angle of the light source in degrees from North. Defaults to 315 degrees.
altitude (float, optional) – The altitude angle of the light source in degrees above the horizon. Defaults to 60 degrees.
exaggerate (float, optional) – The amount of vertical exaggeration to apply to the elevation. Defaults to 1.
filter_method ('str', optional) – The method used to filter the DEM before computing the hillshade. The data GridObject is not filtered. This should be one of the methods provided by GridObject.filter. Defaults to None, which does not apply a filter.
filter_size (int, optional) – The size of the filter kernel in pixels. Defaults to 3.
cmap (colors.Colormap or str or None) – The colormap to use in coloring the data. Defaults to ‘terrain’.
norm (colors.Normalize, optional) – The normalization method that scales the color data to the [0,1] interval. Defaults to a linear scaling from the minimum of the data to the maximum.
blend_mode ({'multiply', 'overlay', 'soft'}, optional) – The algorithm used to combine the shaded elevation with the data. Defaults to ‘soft’.
extent (floats (left, right, bottom, top), optional) – The bounding box used to set the axis limits. If no extent is supplied, defaults to self.extent
**kwargs – Additional keyword arguments are forwarded to matplotlib.axes.Axes.imshow
- Returns:
The image constructed by imshow
- Return type:
matplotlib.image.AxesImage
- Raises:
TypeError – The elev argument is not a GridObject
ValueError – The elev argument is not the same shape as the data
ValueError – A blend_mode other than ‘multiply’, ‘overlay’ or ‘soft’ is provided.
ValueError – The filter_method or filter_size arguments are not accepted by GridObject.filter.
Example
>>> import topotoolbox
>>> import matplotlib.pyplot as plt
>>> dem = topotoolbox.load_dem('perfectworld')
>>> _= dem.plot_hs(exaggerate=dem.cellsize)
>>> plt.show()
(
Source code,png,hires.png,pdf)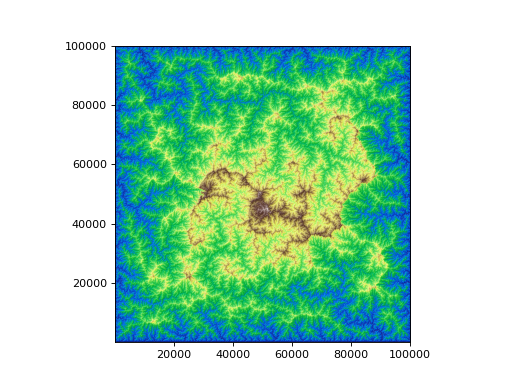
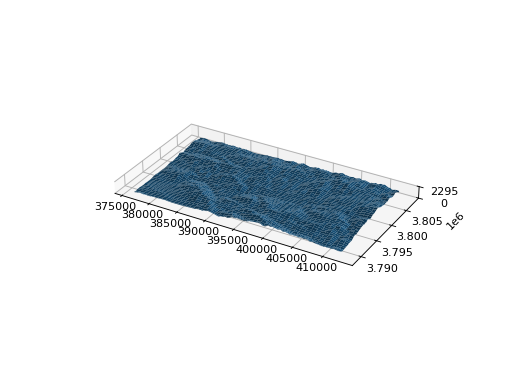
- plot_surface(ax=None, **kwargs)[source]#
Plot DEM as a 3D surface
- Parameters:
ax (matplotlib.axes.Axes, optional) – The axes in which to plot the GridObject. If no axes are given, the current axes are used.
**kwargs – Additional keyword arguments are forwarded to matplotlib.axes.Axes3D.plot_surface.
Example
>>> import topotoolbox
>>> import matplotlib.pyplot as plt
>>> dem = topotoolbox.load_dem('bigtujunga')
>>> fig = plt.figure()
>>> ax = fig.add_subplot(111, projection='3d')
>>> _= dem.plot_surface(ax=ax)
>>> ax.set_aspect('equal')
>>> _= ax.set_zticks([0,np.nanmax(dem)])
>>> plt.show()
(
Source code,png,hires.png,pdf)
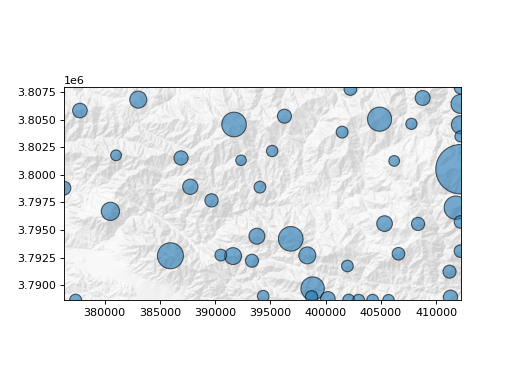
- prominence(tolerance: float, use_hybrid=True) Tuple[source]#
This function calculates the prominence of peaks in a DEM. The prominence is the minimal amount one would need to descend from a peak before being able to ascend to a higher peak. The function uses image reconstruct (see function imreconstruct) to calculate the prominence. It may take a while to run for large DEMs. The algorithm iteratively finds the next higher prominence and stops if the prominence is less than the tolerance, the second input parameter to the function.
- Parameters:
tolerance (float) – The minimum tolerance for the second to last found peak. (meters) Will always find one peak.
use_hybrid (bool, optional) – If True, use the hybrid reconstruction algorithm. Defaults to True.
- Returns:
A Tuple containing a ndarray storing the computed prominence and the geographic coordinates of the peaks, stored as a tuple of ndarray.
- Return type:
Tuple[np.ndarray, Tuple]
Examples
>>> import topotoolbox
>>> import matplotlib.pyplot as plt
>>> from matplotlib.colors import ListedColormap
>>> dem = topotoolbox.load_dem('bigtujunga')
>>> prom, (x, y) = dem.prominence(tolerance=90)
>>> _ = plt.subplot()
>>> _ = dem.plot_hs(cmap=ListedColormap([0.9, 0.9, 0.9]), exaggerate=3)
>>> _ = plt.scatter(x, y, prom, alpha=0.6, edgecolor='black')
>>> plt.show()
(
Source code,png,hires.png,pdf)
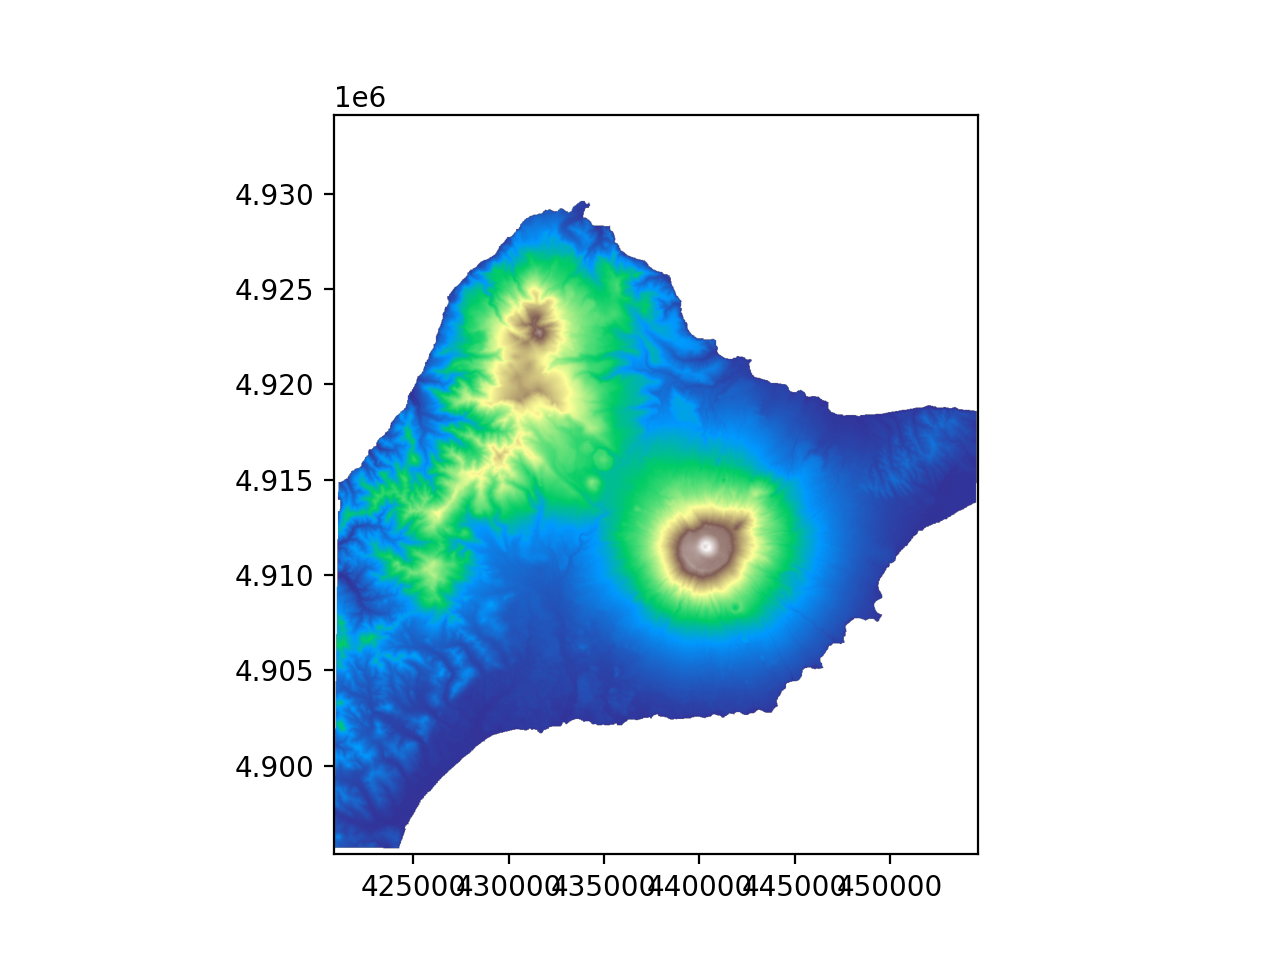
- reproject(georef: CRS, resolution: float | None = None, resampling: Resampling = Resampling.bilinear)[source]#
Reproject GridObject to a new coordinate system.
- Parameters:
georef (rasterio.CRS) – Target coordinate system
resolution (float, optional) – Target resolution. If one is not provided, a resolution that approximately matches that of the source coordinate system will be used.
resampling (rasterio.enums.Resampling, optional) – Resampling method. The default is bilinear resampling.
- Returns:
The reprojected data.
- Return type:
Example
>>> import topotoolbox
>>> import matplotlib.pyplot as plt
>>> from rasterio import CRS
>>> dem = topotoolbox.load_dem('kunashiri')
>>> dem = dem.reproject(CRS.from_epsg(32655), resolution = 30)
>>> _= dem.plot(cmap="terrain")
>>> plt.show()
(
Source code,png,hires.png,pdf)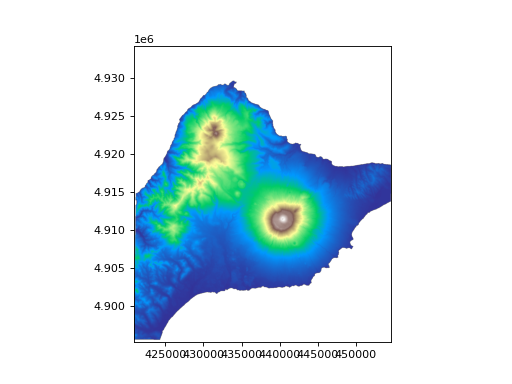
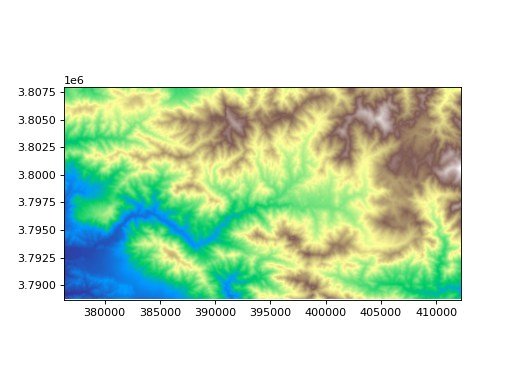
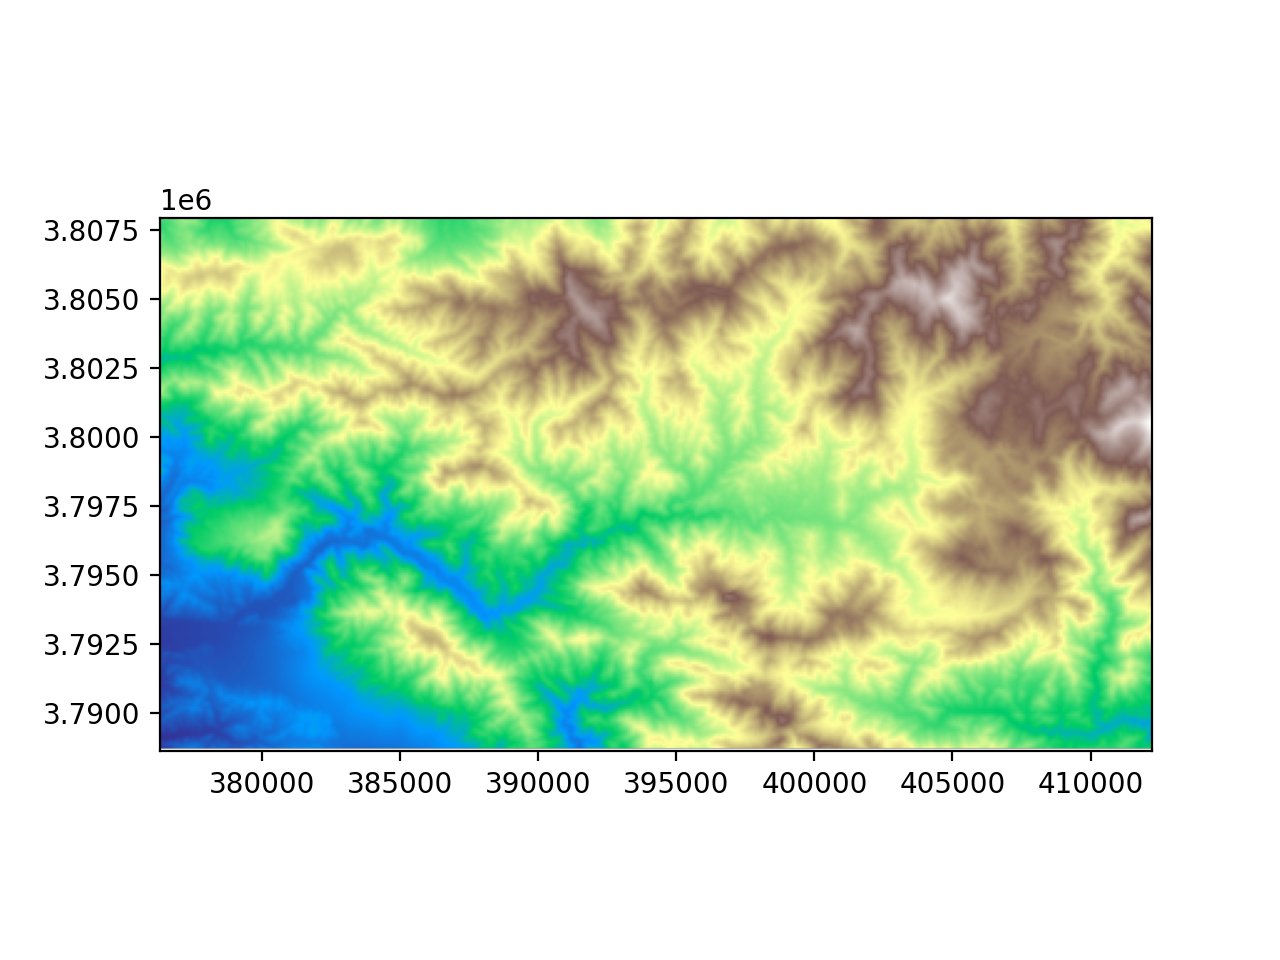
- resample(resolution: float, resampling: Resampling = Resampling.bilinear)[source]#
Resample GridObject to a new resolution.
- Parameters:
resolution (float) – Target resolution in the same units as the current cellsize.
resampling (rasterio.enums.Resampling, optional) – Resampling method. The default is bilinear resampling.
- Returns:
The resampled data.
- Return type:
Example
>>> import topotoolbox
>>> dem = topotoolbox.load_dem('bigtujunga')
>>> dem_90m = dem.resample(resolution=90)
>>> im = dem_90m.plot(cmap="terrain")
>>> plt.show()
(
Source code,png,hires.png,pdf)
- property rows#
The size of the first dimension of the grid
- property shape#
Tuple of grid dimensions
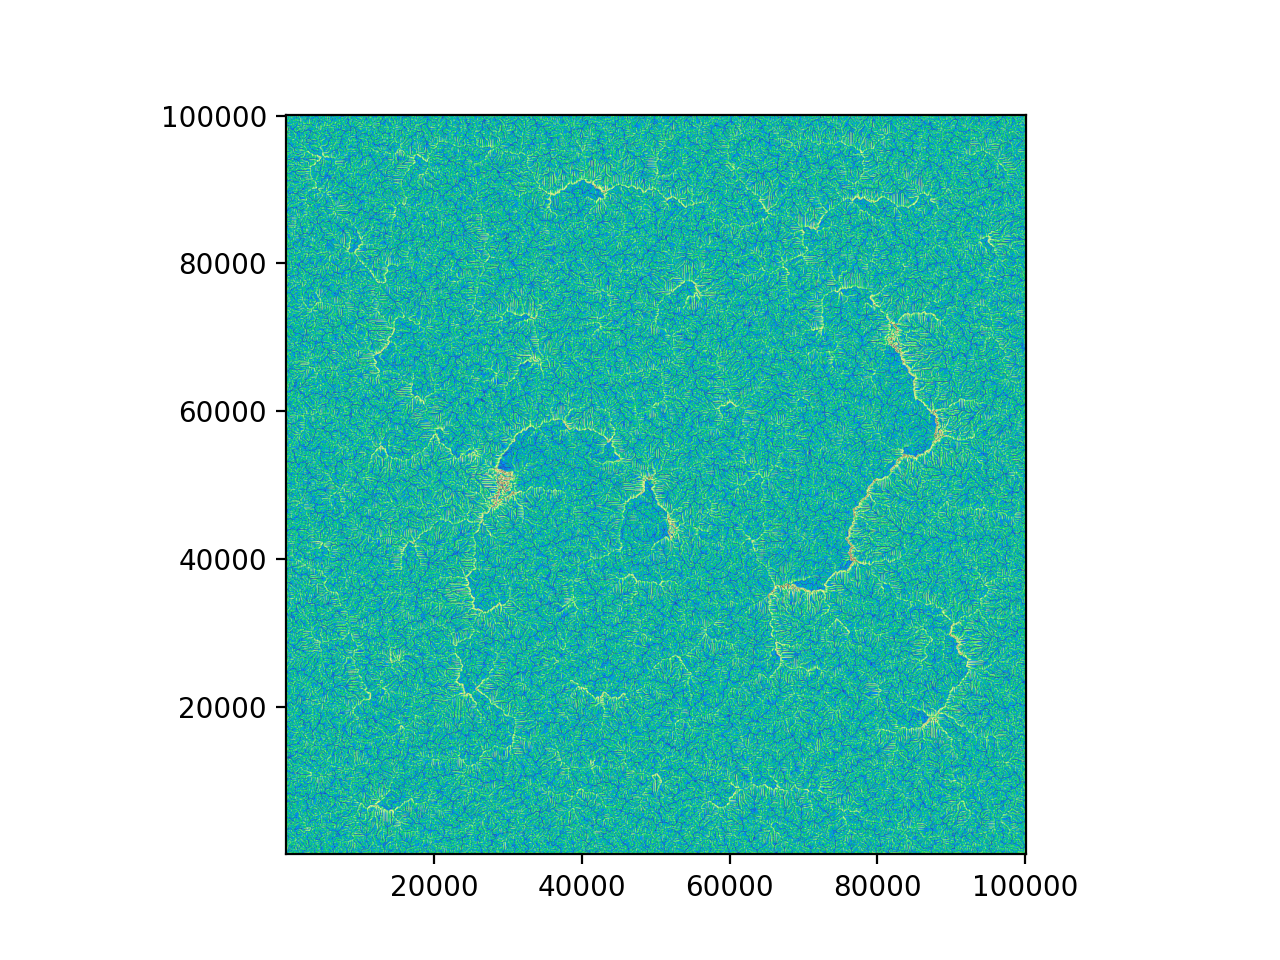
- shufflelabel(seed=None)[source]#
Randomize the labels of a GridObject
This function is helpful when plotting drainage basins. It will work with any kind of data, but is most useful when given ordinal data such as an integer-valued GridObject.
- Parameters:
seed (optional) –
The seed used to generate the random permutation of labels.
The seed is passed directly to numpy.random.default_rng.
- Returns:
A grid identical to the input, but with randomly reassigned labels.
- Return type:
Example
>>> import topotoolbox
>>> import matplotlib.pyplot as plt
>>> dem = topotoolbox.load_dem('bigtujunga')
>>> fd = topotoolbox.FlowObject(dem)
>>> D = fd.drainagebasins()
>>> _= D.shufflelabel().plot(cmap="Pastel1",interpolation="nearest")
>>> plt.show()
(
Source code,png,hires.png,pdf)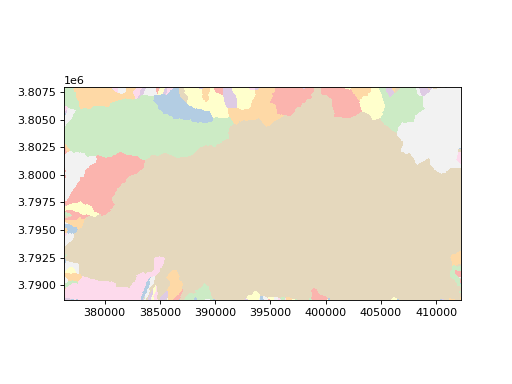
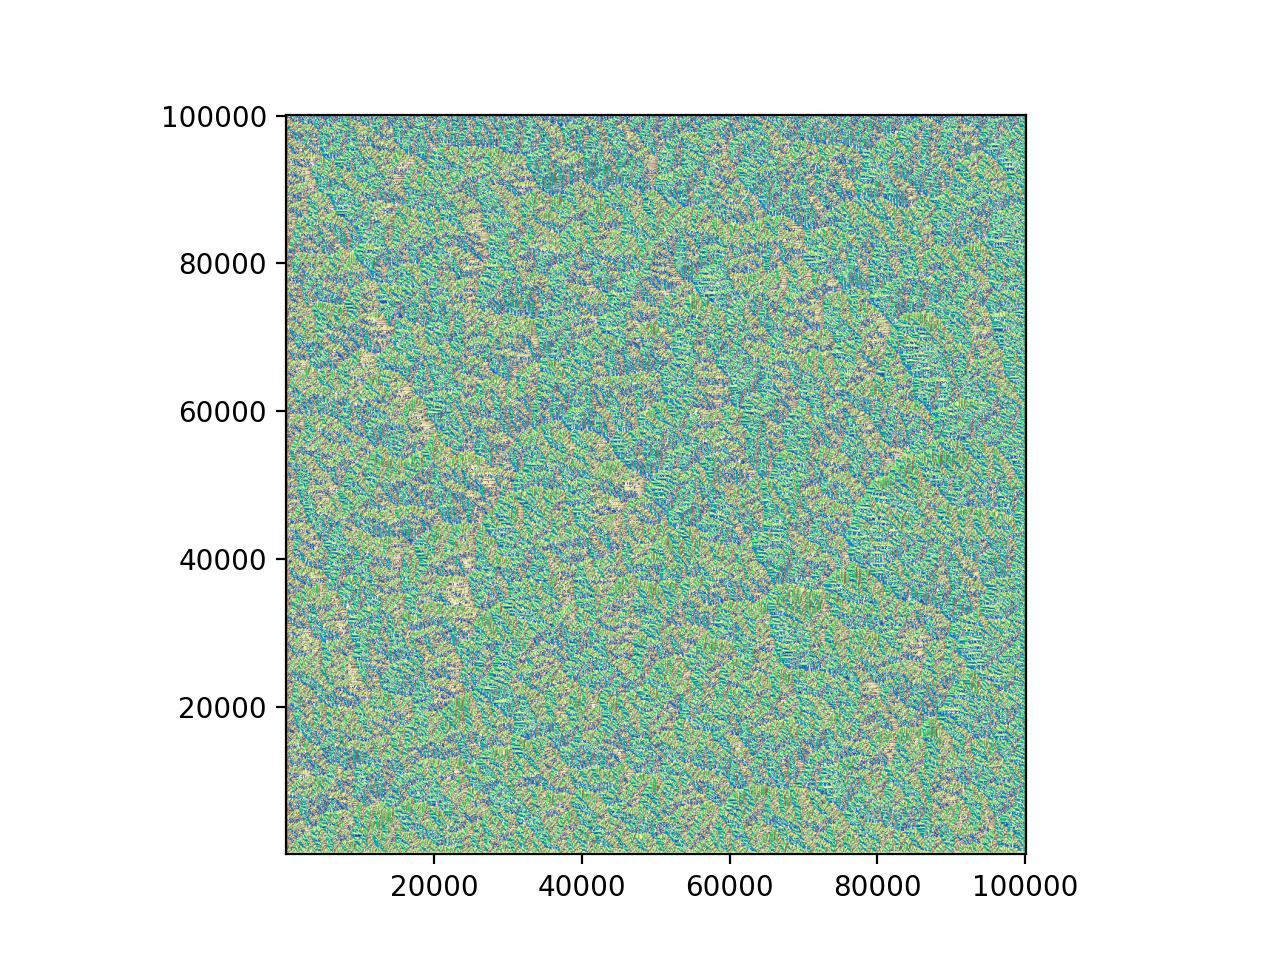
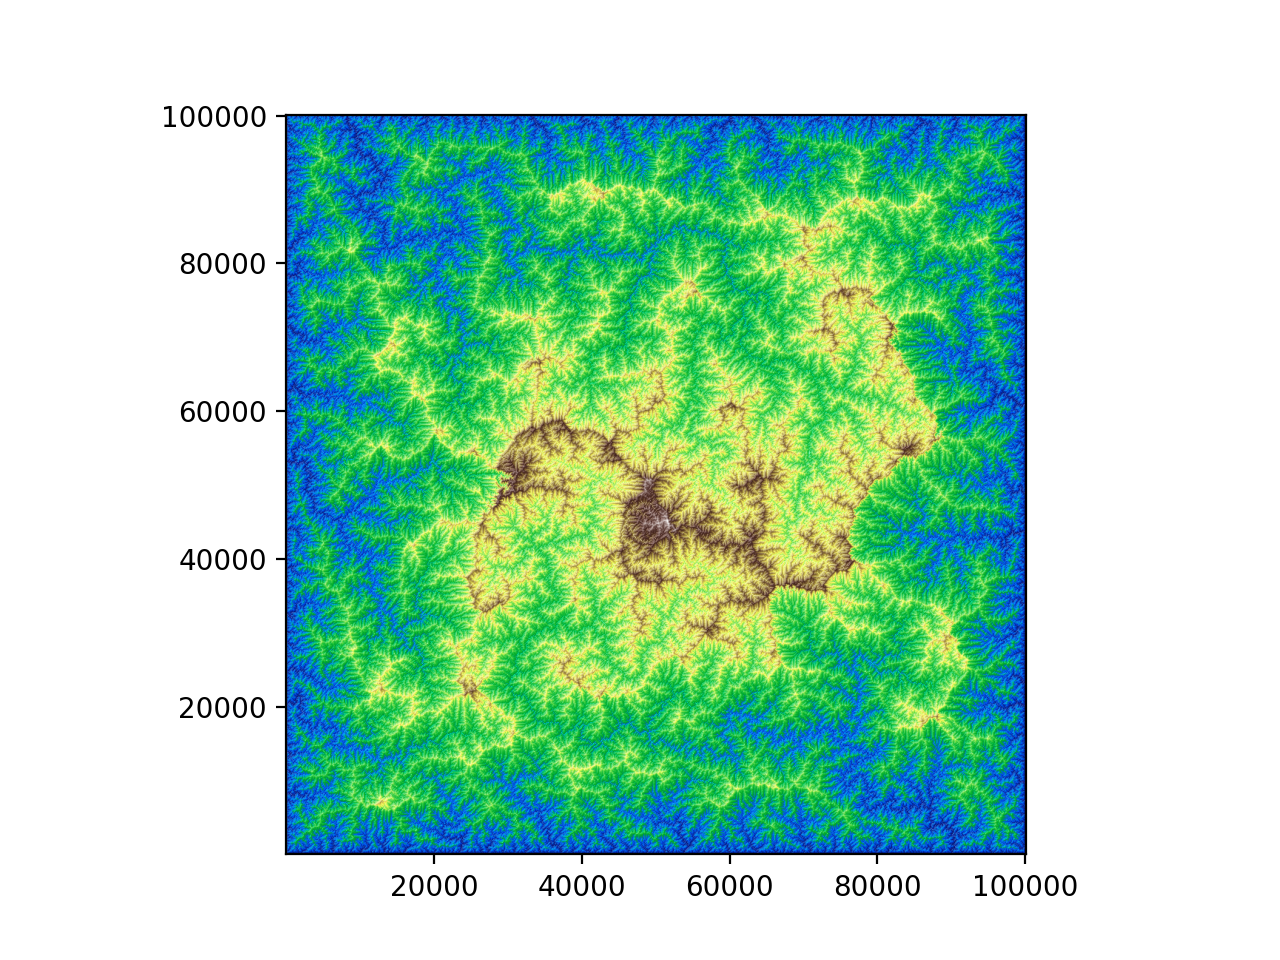
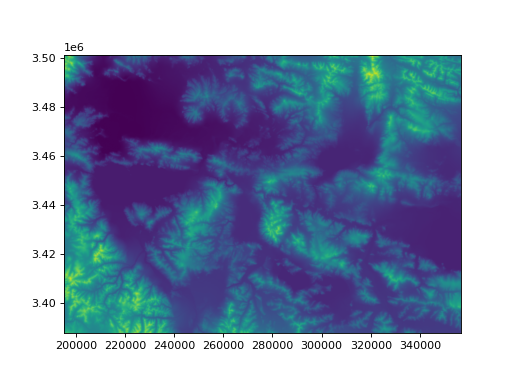
- zscore(dtype=None)[source]#
Returns the z-score for each element of GridObject such that all values are centered to have mean 0 and scaled to have standard deviation 1.
- Parameters:
dtype – The data type of the resulting array. zscore uses np.float64 internally for precision and will convert back to the input GridObject’s data type by default. If the additional precision is necessary, pass np.float64.
- Returns:
A GridObject containing the z-scores of the input GridObject.
- Return type:
Example
>>> import topotoolbox
>>> import matplotlib.pyplot as plt
>>> dem = topotoolbox.load_dem('tibet')
>>> dem_zscore = dem.zscore()
>>> _= dem_zscore.plot()
>>> plt.show()
(
Source code,png,hires.png,pdf)