Subdivide and merge DEMs (MATLAB)#
Authors#
This notebook is licensed under CC-BY 4.0.
Highlighted References#
Schwanghart, W. and Scherler, D.: TopoToolbox 2 – MATLAB-based software for topographic analysis and modeling in Earth surface sciences, Earth Surface Dynamics, 2, 1–7, https://doi.org/10.5194/esurf-2-1-2014, 2014.
Audience#
For beginners and more advanced users of TopoToolbox.
Introduction#
Subdividing your DEM into multiple tiles is required if you want to make it available using a tile server. Tiling your DEM may also be required if you want to apply deep learning techniques such as convolutional neural networks because they usually require input images to be of consistent size. This workbook shows how to subdivide your DEM into tiles of predefined size. Moreover, you will learn how to reverse this operation: merging multiple tiles of DEMs into one big DEM.
Dependencies#
To run this code, you’ll just need TopoToolbox including its required toolboxes.
Subdividing a raster into tiles#
Before we start, let’s download a good example. We are going to use the Taiwan DEM which is part of the lightweight repository for DEM examples for TopoToolbox.
[1]:
% Download the example using readexample
DEM = readexample('taiwan');
DEM
[1]:
DEM =
  GRIDobj with properties:
           Z: [4181x2253 single]
    cellsize: 90
          wf: [2x3 double]
        size: [4181 2253]
        name: 'taiwan'
       zunit: ''
      xyunit: ''
      georef: [1x1 map.rasterref.MapCellsReference]
The DEM has a few thousands columns and rows. Now let’s use the function GRIDobj/subdivide to subdivide the DEM into tiles. The function takes a GRIDobj and the size of the tiles (here 100 rows and 100 columns), and returns a cell array of GRIDobj, each element containing a tile. Let’s try it out.
[2]:
CDEM = subdivide(DEM,"tilesize",[100 100]);
Some of the tiles will have fewer rows and columns than specified because the original DEM’s dimensions are not integer multiples of 100. The following code line shows how to identify these tiles. We use cellfun, a function that lets you apply a function to each entry of a cell array.
[3]:
I = cellfun(@(x) ~isequal(x.size,[100 100]),CDEM);
nnz(I)
[3]:
ans = 64
There are 64 tiles that do not match our prescribed size. They occur along the eastern and southern border of the original DEM, and an easy approach could be to remove them. Alternatively, we could pad these tiles with nans. As the function subdivide starts tiling from the northwest, we are growing the tiles in southern and eastern direction (note the second input argument into the function pad, which defines how much a raster should grow (or shrink) into the four directions).
[4]:
CDEM(I) = cellfun(@(x) pad(x,[0 100-x.size(1) 0 100-x.size(2)],nan),CDEM(I),...
    'UniformOutput',false);
Let’s check whether all tiles have a valid size.
[5]:
I = cellfun(@(x) ~isequal(x.size,[100 100]),CDEM);
nnz(I)
[5]:
ans = 0
Great, now all tiles have the right size.
Now let’s also identify those tiles that only have nans and remove them.
[6]:
I = cellfun(@(x) all(isnan(x)),CDEM);
CDEM(I) = [];
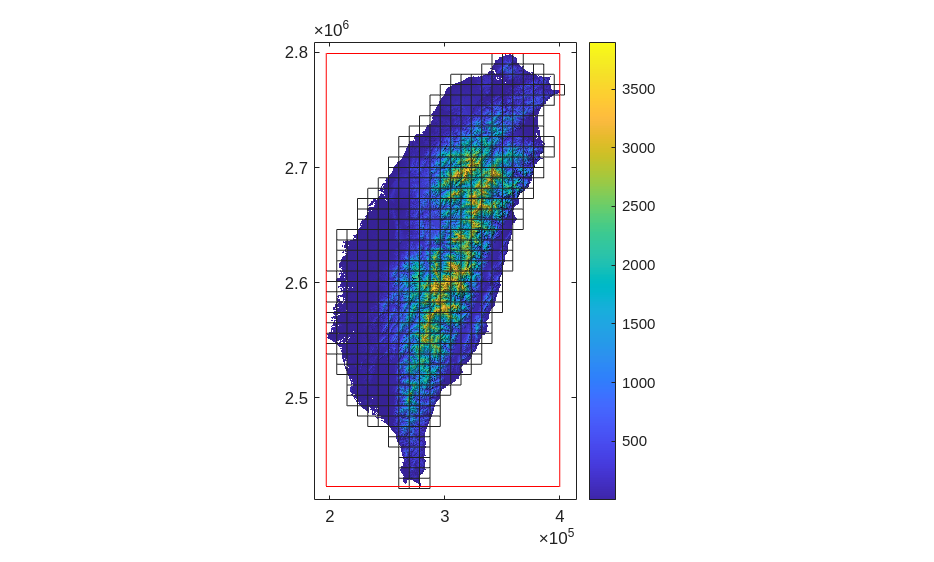
Let’s make sure we are on the right track and plot the outlines of the remaining tiles.
[7]:
imageschs(DEM)
cellfun(@(x) mapshow(getoutline(x),'FaceColor','none'),CDEM);
hold on
mapshow(getoutline(DEM),'FaceColor','none','EdgeColor','r')
padextent(10000,gca)
hold off
[7]:
[8]:
savefig('tileImage');
This looks great. The red outline shows the extent of the original DEM. We padded tiles where necessary, so that the final tiles expand the extent of the original DEM. Note, however, that we could have padded the DEM from the beginning on, obtaining the same result.
Merging multiple rasters#
Sometimes, you may face the task to merge multiple rasters into one large raster, an operation often also referred to as mosaicking.
TopoToolbox has a mosaic function that uses and expands on the Mapping Toolbox’s own mergetiles function. The function takes a list of GRIDobj. If you have these rasters in a cell array (as we obtained above), you can call mosaic like this:
[9]:
DEMn = mosaic(CDEM{:});
Plot DEMn to make sure that everything looks good.
[10]:
figure
imageschs(DEM)
[10]:
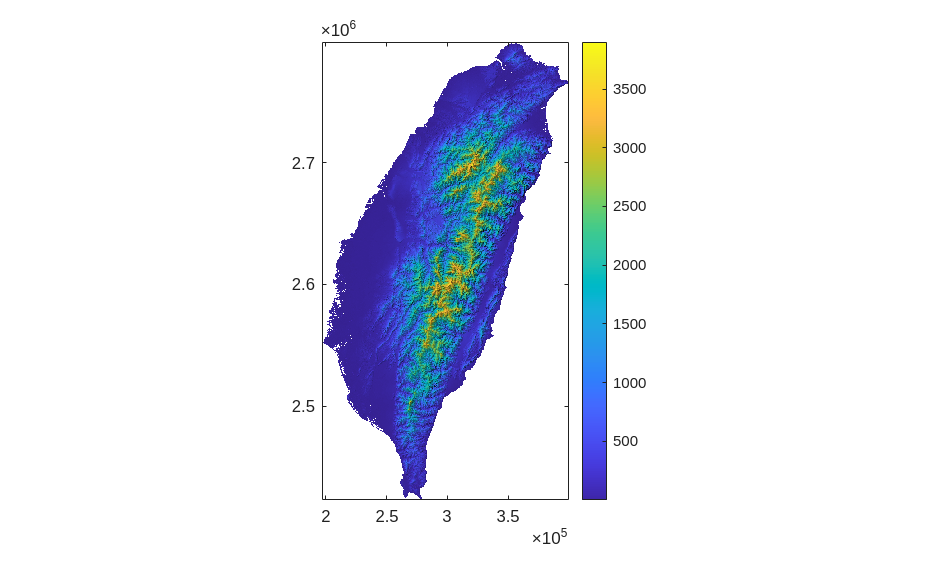
That’s it.
[11]:
openfig('tileImage');
[11]:

[12]:
delete('tileImage.fig')
References and Additional Information#
Schwanghart, W. and Scherler, D.: TopoToolbox 2 – MATLAB-based software for topographic analysis and modeling in Earth surface sciences, Earth Surface Dynamics, 2, 1–7, https://doi.org/10.5194/esurf-2-1-2014, 2014.