Color functions in TopoToolbox (MATLAB)#
Authors#
This notebook is licensed under CC-BY 4.0.
Highlighted References#
Schwanghart, W., Scherler, D. (2014): TopoToolbox 2 – MATLAB-based software for topographic analysis and modeling in Earth surface sciences. Earth Surface Dynamics, 2, 1-7. [DOI: 10.5194/esurf-2-1-2014]
Audience#
If you are using MATLAB not only as a computational tool but also as a means to create visually appealing maps and graphics, this is for you.
Introduction#
One important ingredient of nice graphics is the clever use of colors. Hence, TopoToolbox features some functions that provide access to different colormaps. You’ll find these in the folder colormaps. The folder also contains a bunch of other functions that you may be not aware of. Hence, this notebook is about these functions.
Dependencies#
There are no other dependencies than those required by TopoToolbox.
Creating a map of the Taal Volcano DEM#
Before we start, let’s download a good example. We are going to use the Taal Volcano DEM which is part of the lightweight repository for DEM examples for TopoToolbox.
[1]:
% Download the example using readexample
DEM = readexample('taalvolcano');
[1]:
28-Jul-2026 08:11:52 -- Downloading...
28-Jul-2026 08:11:53 -- Download finished...
[2]:
% Water surfaces in the crater will be set to nan
I = identifyflats(DEM);
I.Z = bwareaopen(I.Z,1000);
DEM = clip(DEM,~I);
One of the most important color functions in TopoToolbox is ttscm. The function provides easy access to Fabio Crameri‘s Scientific Colormaps (see references to Fabio’s work below). But, how do I know which colormaps it provides? Simply call the function without any input and output arguments:
[3]:
ttscm
[3]:
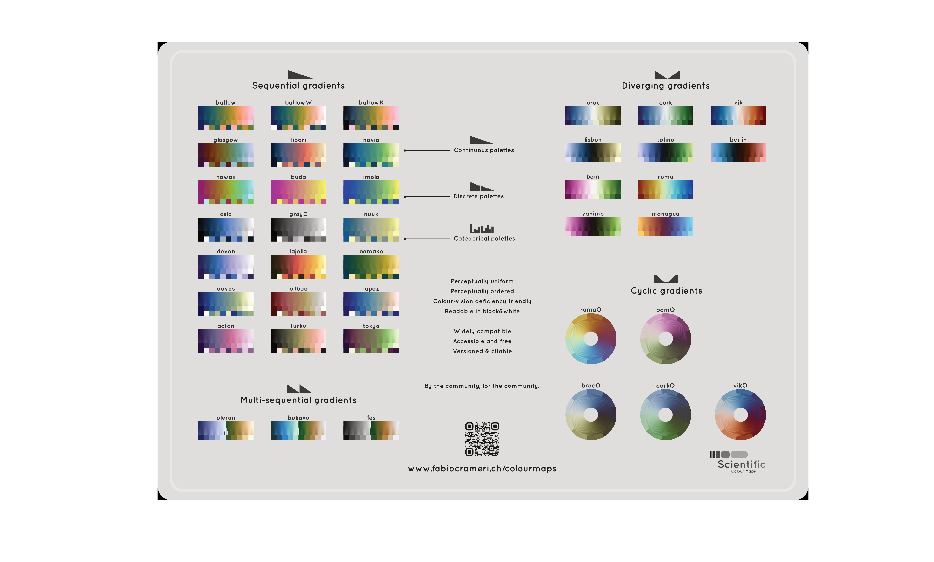
Great, let’s make a slope map using the colormap bilbao. We will flip the colormap so that high slope values have darker colors.
[4]:
% Calculate slope
S = arcslope(DEM);
% Colored hillshade. Percent clipping avoids that few, high slope
% values dominate the color range.
imageschs(DEM,S,'colormap',flipud(ttscm('bilbao')),"percentclip",[0 99],...
    "colorbarylabel","Slope [-]")
[4]:
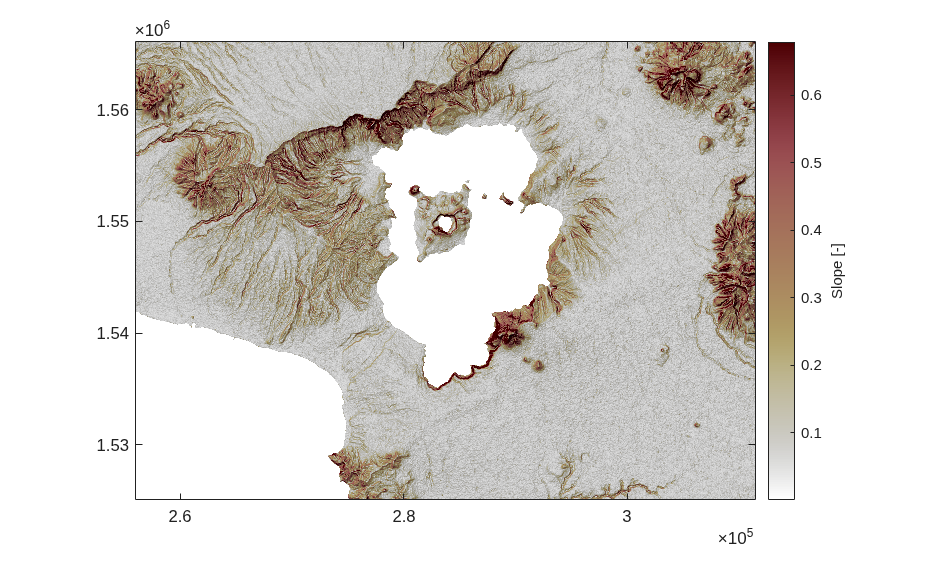
Some of Fabio’s colormaps tend to be very dark at one end. Thus, note that ttscm takes an input argument that let’s you truncate the colormap at some percentiles.
The map looks good, but I don’t like the white color of the water surfaces. How about giving those regions some nice blue color. That is where the function ttclr comes in handy.
[5]:
imageschs(DEM,S,"colormap",flipud(ttscm('bilbao')),...
          "percentclip",[0 99],...
          "nancolor",ttclr('lake'),...
          "colorbarylabel","Slope [-]")
[5]:
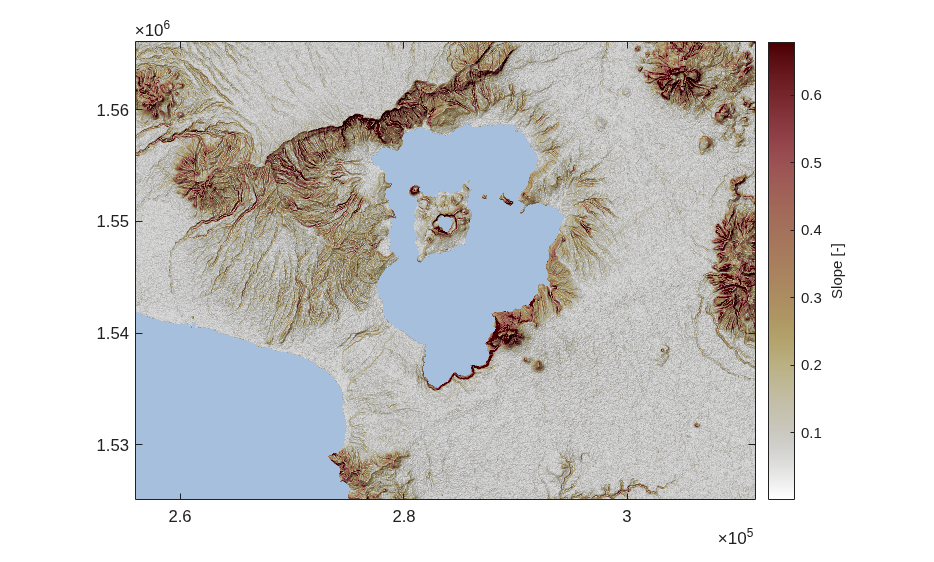
This looks much better. However, good topographic maps have some darker blue outlines around their water bodies.
[6]:
[x,y] = getoutline(DEM,"shownans",true);
hold on
plot(x,y,'Color',ttclr('lakeoutline'))
[6]:
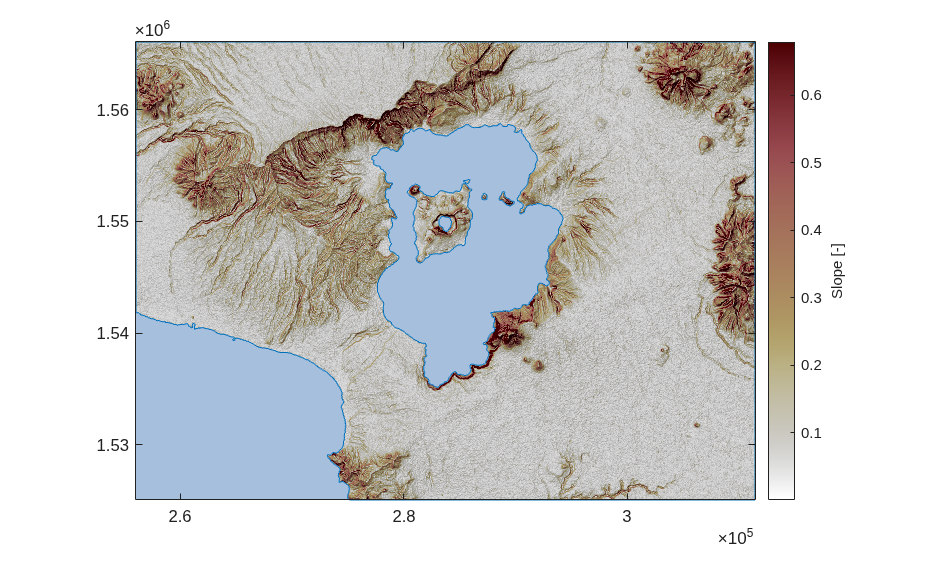
Great, that looks way better.
ttclr is a quite simple function and the selection of colors for surfaces is rather limited: lake, lakeoutline, glacier, meadow, river and desert. The colors for river and lakeoutline are the same, by the way.
[7]:
FD = FLOWobj(DEM);
S  = STREAMobj(FD,minarea = 5000);
hold on
plotstreamorder(S,"colormap",ttclr('river'),"legend",false)
[7]:
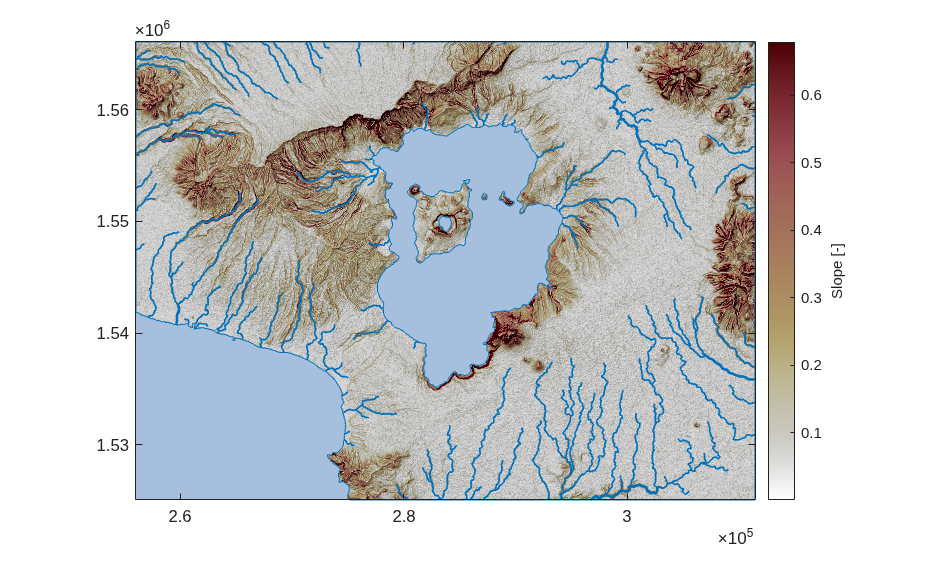
If you want to add some more colors to ttclr, let me know!
In addition to ttclr there is a function called ttclrr. Admittedly, the name of this function is rather unhelpful for knowing what this function does. It is a function that I “borrowed” from R. It takes a string (or character array) of a color name (e.g. ‘white’ or ‘gray’ or ‘skyblue’) and translates it into a rgb triple. Call ttclrr without any input and output arguments and you’ll get an entire list. Let’s use ttclrr to equip our map with a decent label.
[8]:
SB = subplotlabel(gca,'Taal Volcano',...
                  "color",ttclrr("slategray"),...
                  "Location","southwest");
niceticks
bigger(SB,1)
[8]:

There are more functions in the colormaps-folder including colormaps for plotting land elevations (landcolor), combined bathymetric/topographic maps (ttcmap) and water flow (flowcolor). Have fun exploring these if you make your maps and graphics with TopoToolbox.
Note also that we aim to offer good color choices in TopoToolbox Python implementation, too. Luca Malatesta has made a great start to use appropriate colors in our documentation.
References and Additional Information#
Crameri, F. (2018). Scientific colour maps. Zenodo. https://doi.org/10.5281/zenodo.1243862
Crameri, F. (2018), Geodynamic diagnostics, scientific visualisation and StagLab 3.0, Geosci. Model Dev., 11, 2541-2562, https://doi.org/10.5194/gmd-11-2541-2018
Crameri, F., G.E. Shephard, and P.J. Heron (2020), The misuse of colour in science communication, Nature Communications, 11, 5444, https://doi.org/10.1038/s41467-020-19160-7